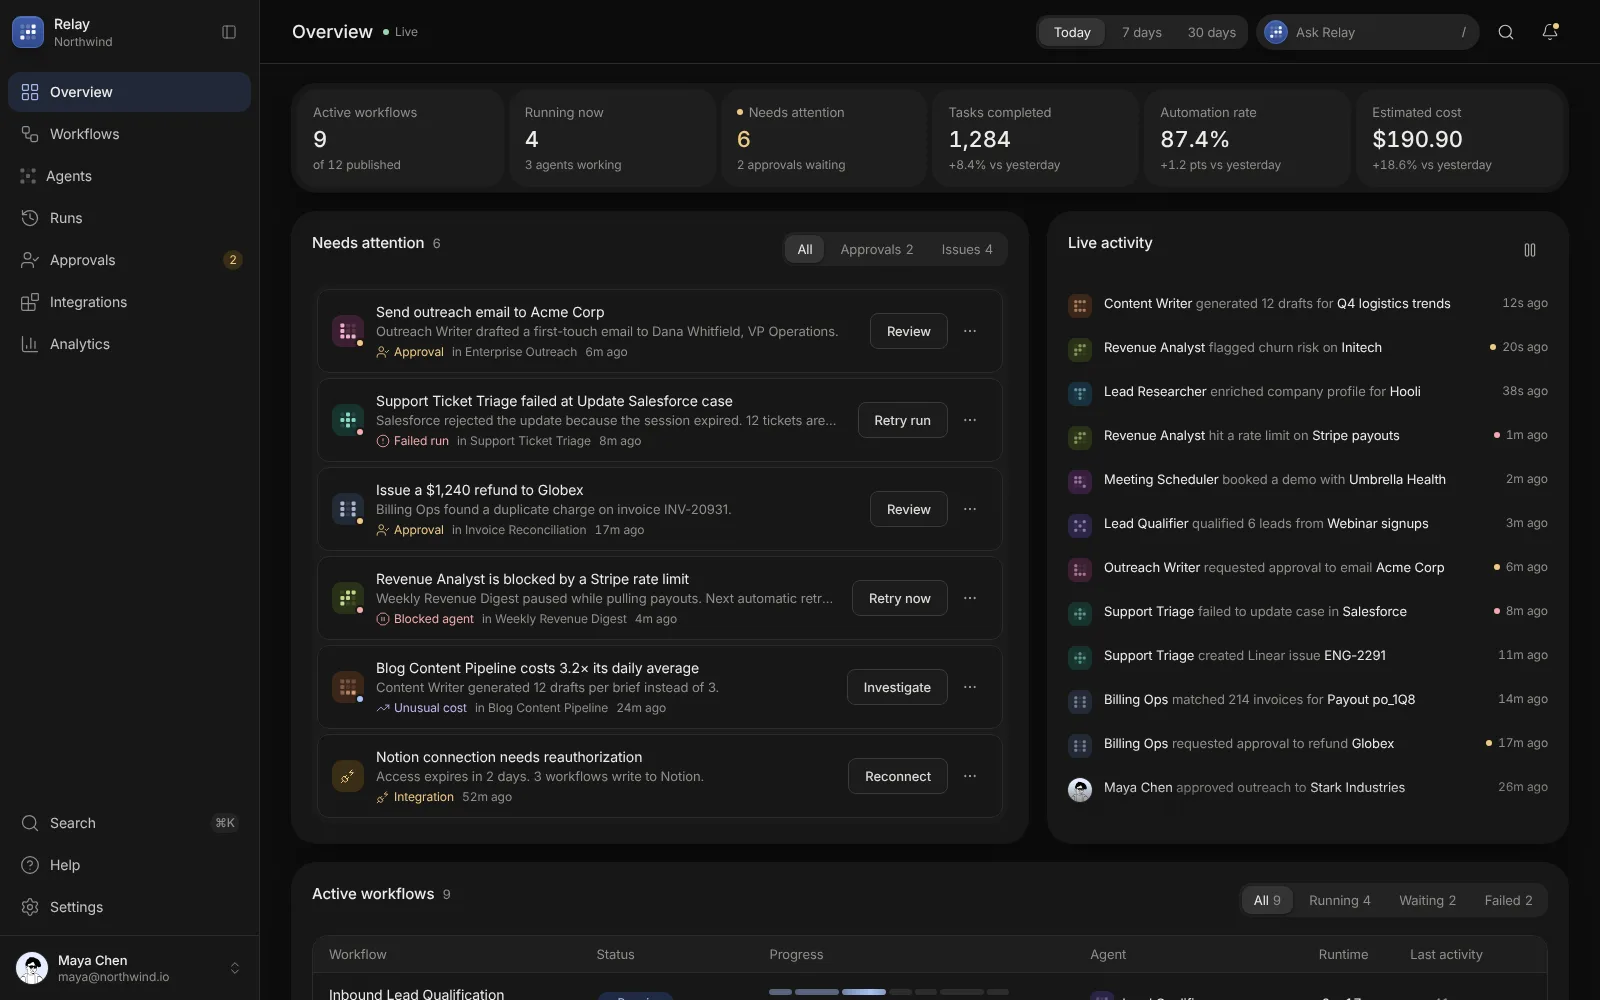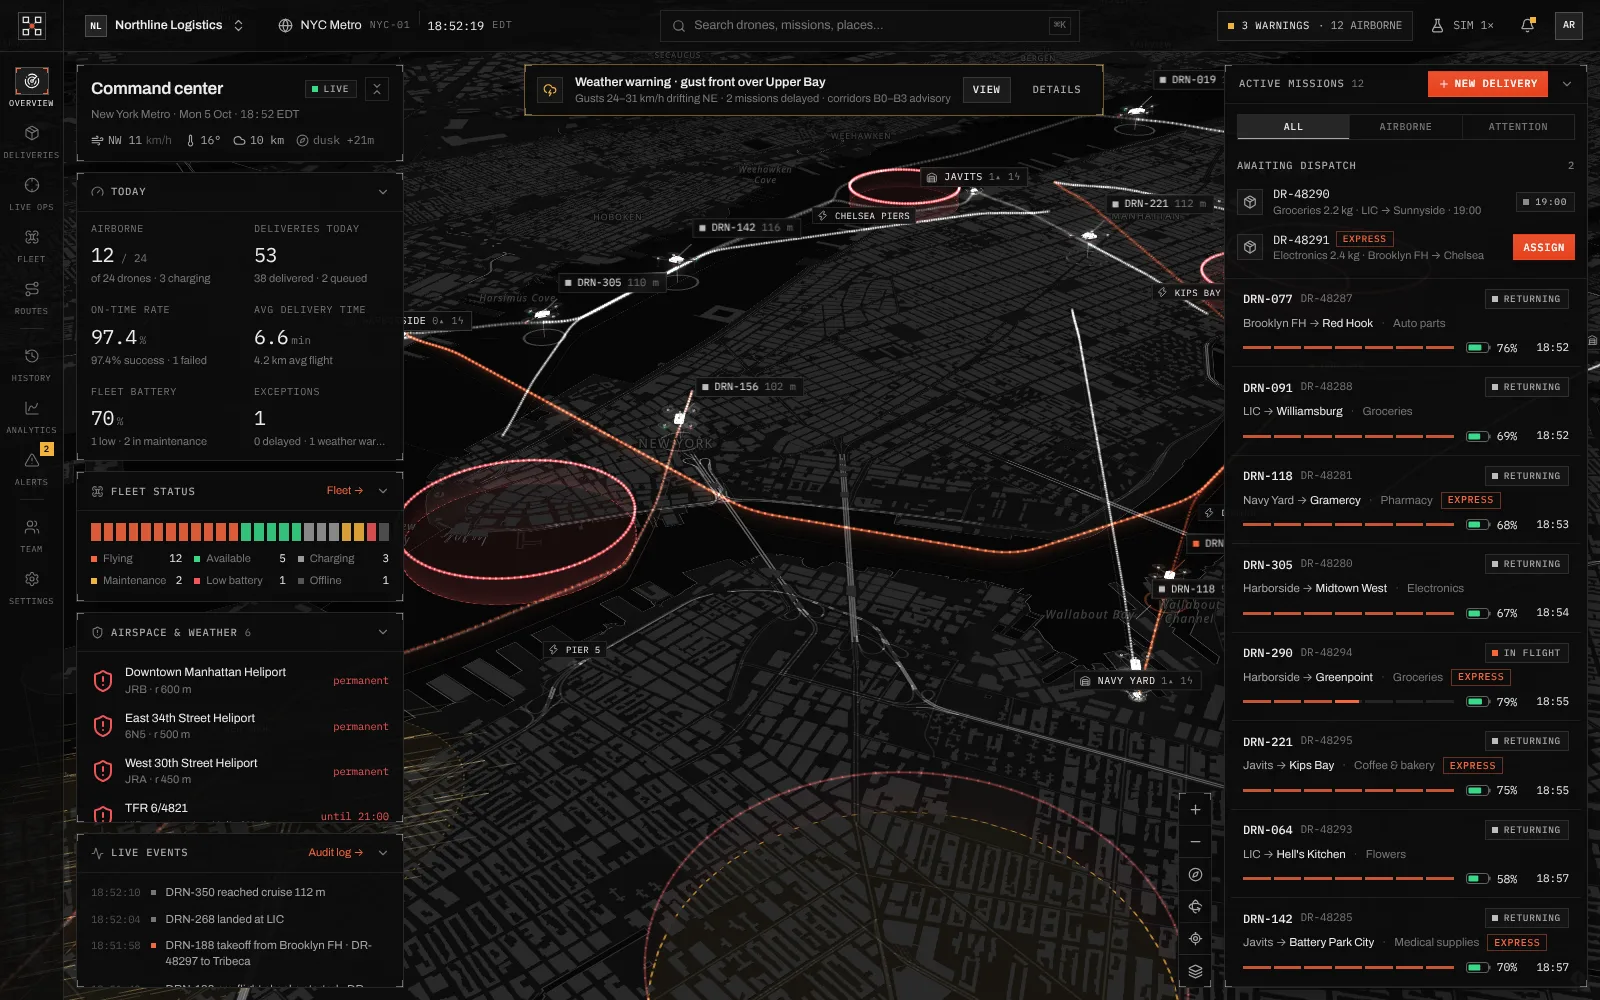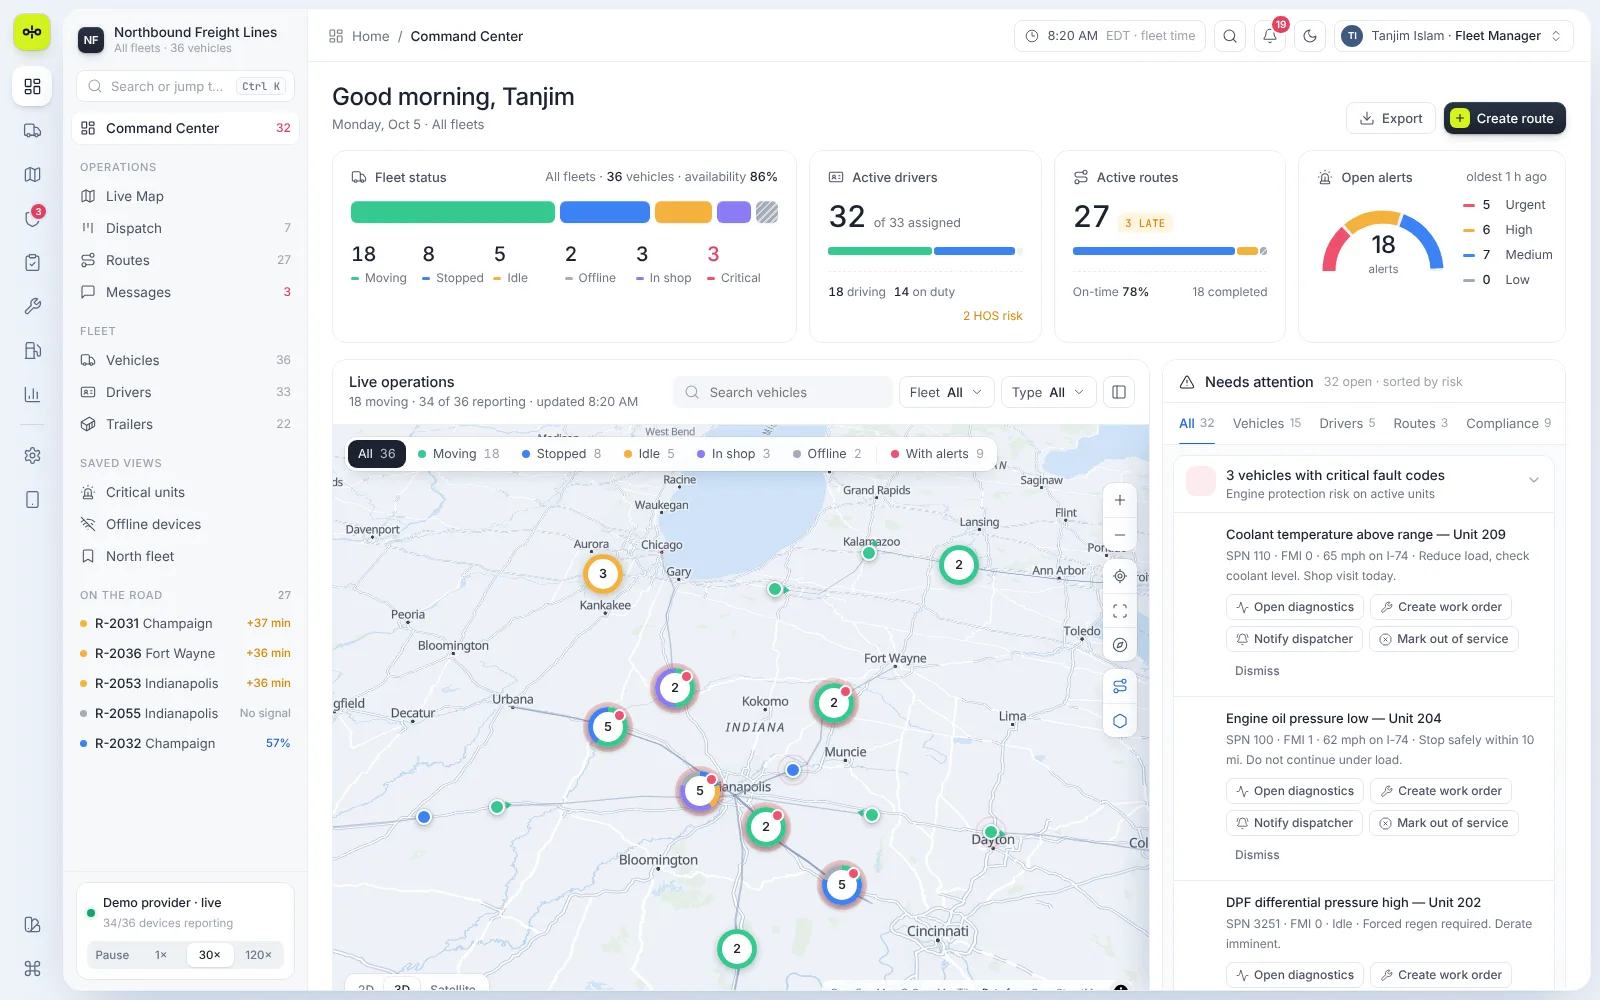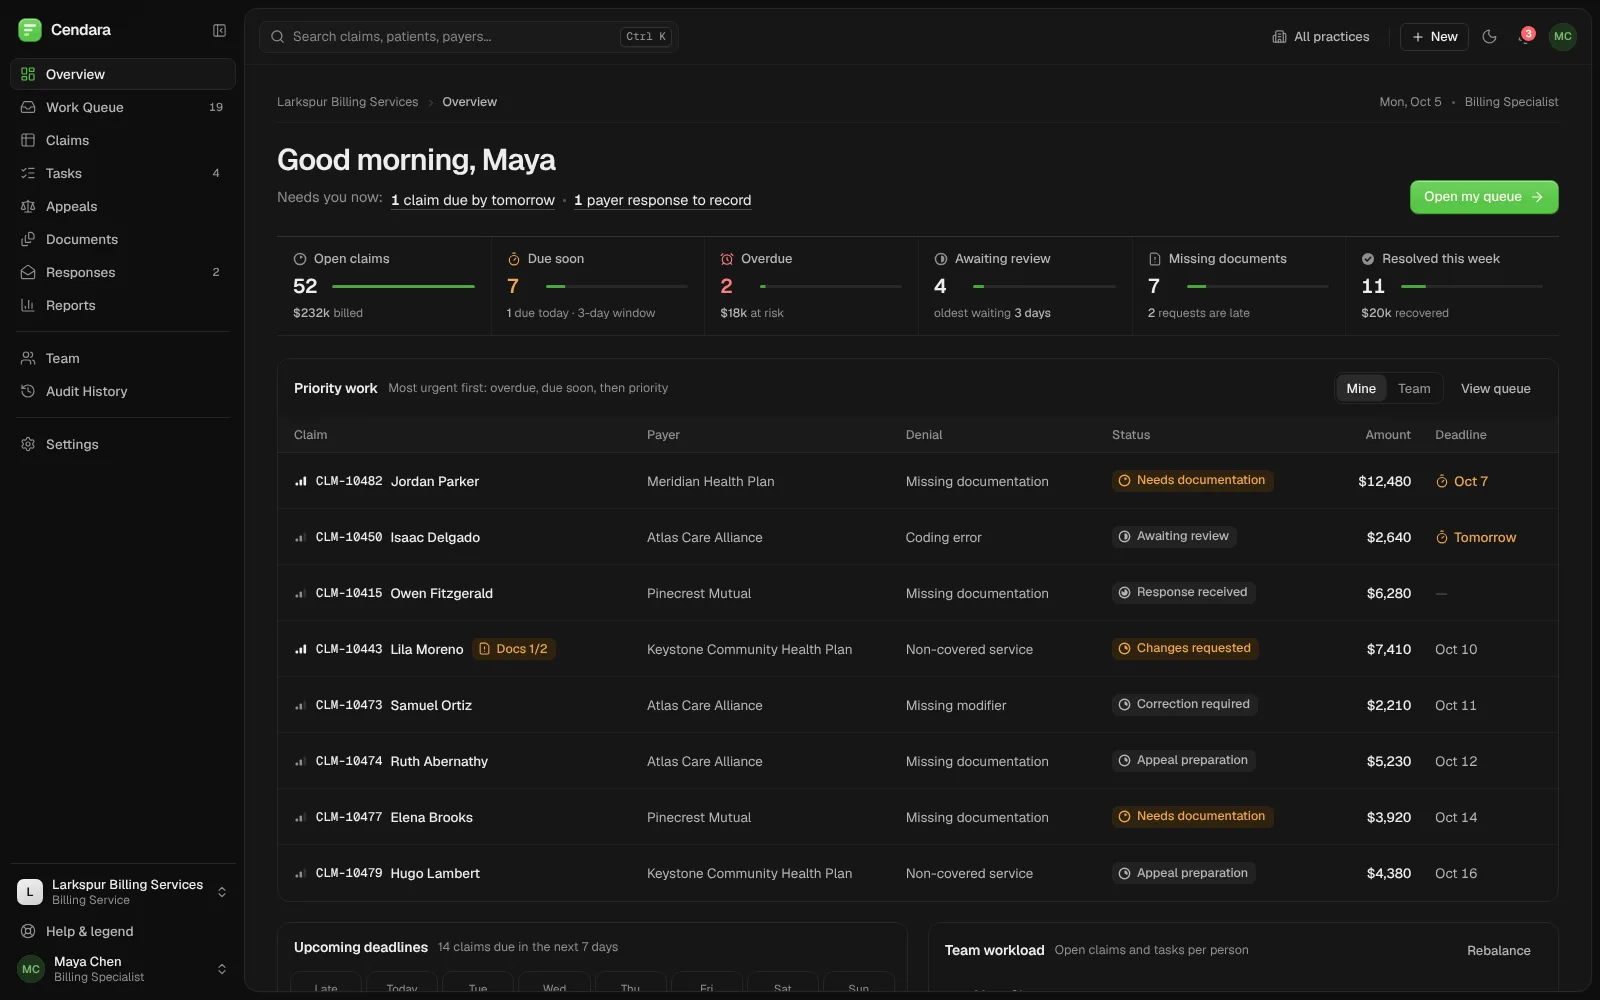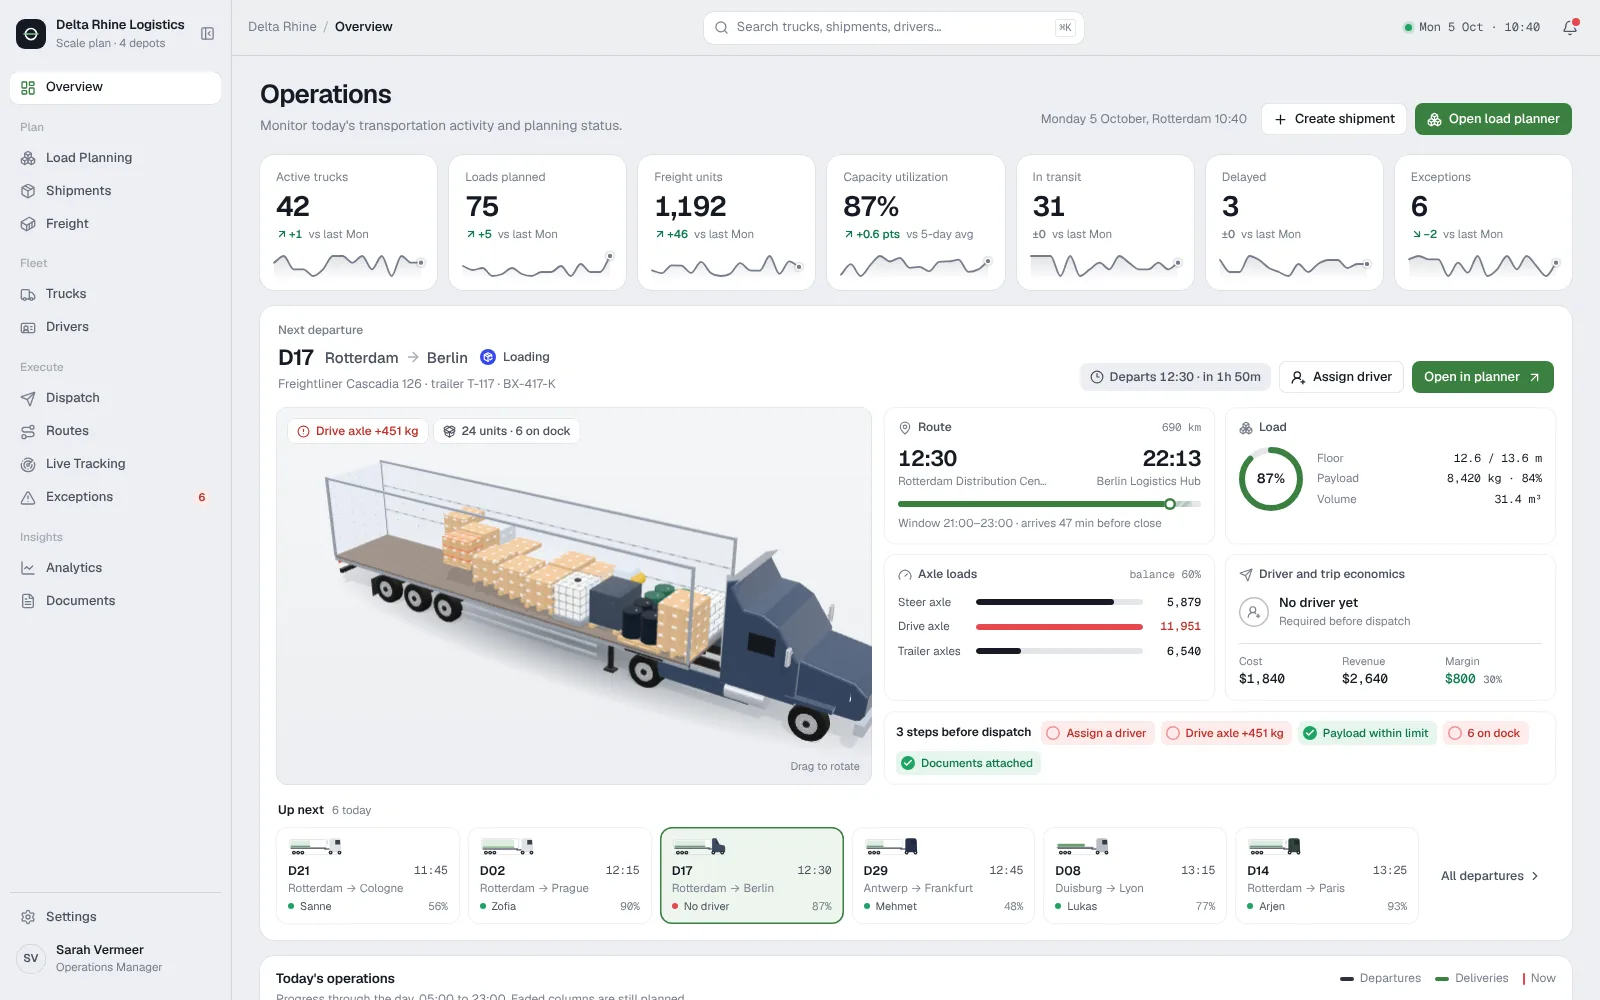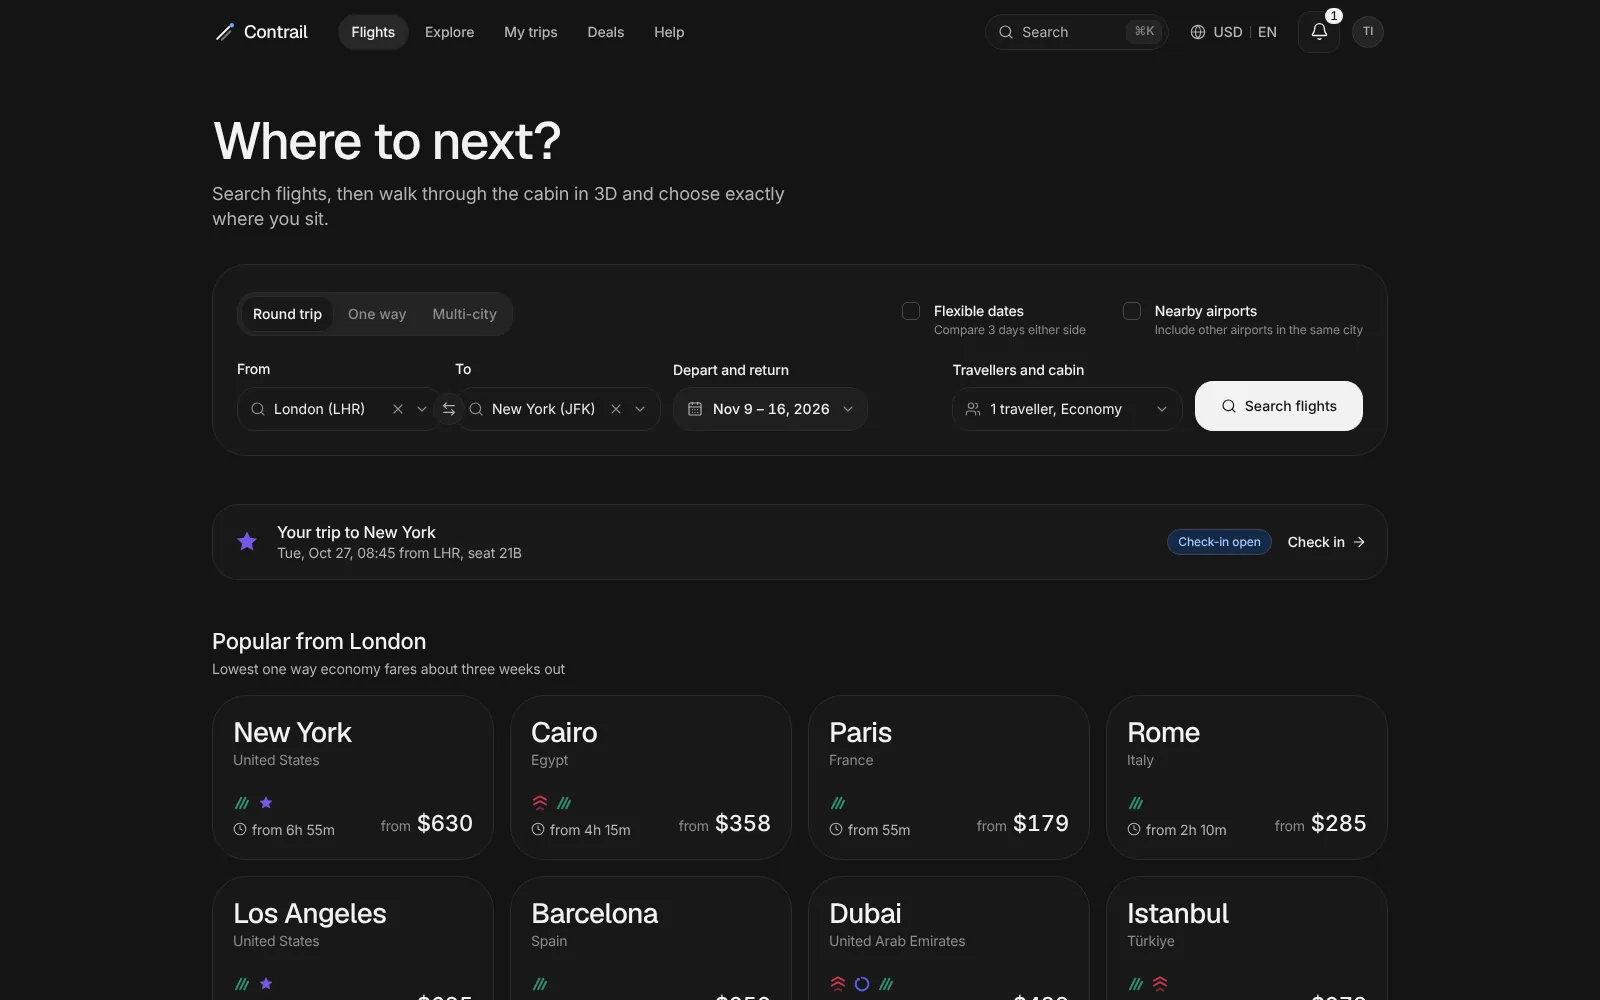


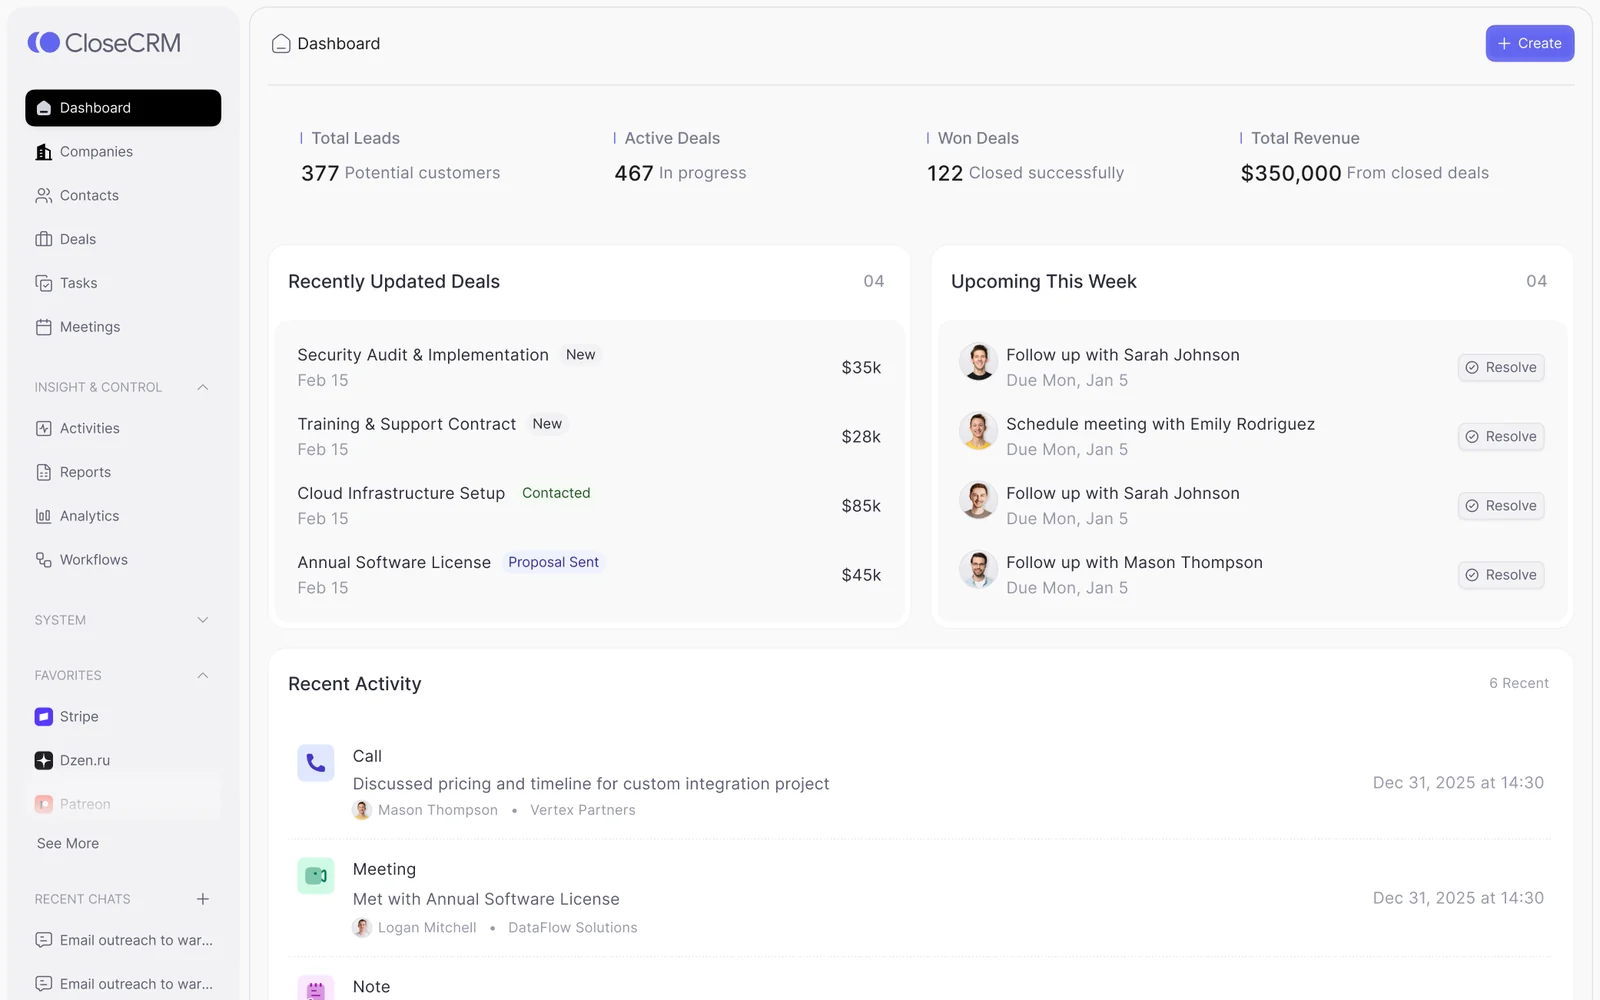
CloseCRM: a calmer workspace for busy sales teams.
How we organised leads, deals, tasks and automation into one structured CRM that reps can scan in seconds.
Built by Gr8r for its own portfolio. Not client work.
- Client
- CloseCRM
- Project
- CRM web app and website
- Platforms
- Web app, desktop-first
- Timeline
- 62 days, 3 phases
- Deliverable
- Dev-ready Figma + prototype
The problem
Make a busy pipeline easy to read.
Reps and managers work across companies, contacts, deals, tasks and inboxes. When those live in separate places, the next action is hard to spot and records drift out of date. We framed the brief around two questions: what should a rep do next, and what does a manager need to trust the pipeline?
- 1
Next action is buried
Priorities are split across task lists, calendars and inboxes. Before any selling starts, the rep pieces the day together by hand, and urgent work looks the same as routine work.
“Which follow-up should I do first?”
- 2
Context is scattered
Calls, emails, meetings and notes live in different places. Reviewing a deal means opening several tabs, and handing it to a teammate means re-explaining the story.
“What happened last week?”
- 3
Data isn't structured
When fields differ from record to record, reports need manual clean-up and automation cannot run safely. Confidence in the numbers drops, and so does adoption.
“Can I trust this pipeline number?”
Affinity mapping
Eight themes from 200+ research notes.
We grouped 200+ research notes into eight themes to find where the biggest opportunities were.
Lead Management
- Leads arrive from 5+ sources
- Duplicate contacts
- No clear owner
Pipeline Visibility
- Stuck deals go unnoticed
- Stages mean different things
- No probability view
Daily Workflow
- Too many tabs
- Manual note-taking
- Forgotten follow-ups
Communication
- Emails outside the CRM
- Lost call context
- Team handoffs fail
Data & Analytics
- Reports built by hand
- No target tracking
- Mistrust in numbers
User Experience
- Cluttered screens
- Slow search
- Hard to learn
Admin & Ops
- Inconsistent fields
- Messy imports
- Permission confusion
Automation & AI
- Repetitive updates
- Wants auto follow-ups
- Needs clean data first
Grouped from the project's research notes in our Close CRM affinity map.
Information architecture
The day's work first, insight and setup after.
The sidebar groups the product by what the rep is doing, in the same order as the app.
Main
- Dashboard
- Companies
- Contacts
- Deals
- Tasks
- Meetings
Insight & control
- Activities
- Reports
- Analytics
- Workflows
Settings
- Profile
- Mailboxes
- Notifications
- Users & teams
- Billing & plans
- Security
- Integrations
- API keys & SDKs
The workflow
One path, from login to automation.
- 1
Start the day
The dashboard and one ranked task list show what to do next.
- 2
Work the deal
The deal board shows stage, amount and close date on every card.
- 3
Keep the record
Calls, emails, meetings and notes land on the contact and company.
- 4
Automate
Workflows run the repeat work on the same structured fields.
The product
Depth without the clutter.
Six close-ups that show how the interface handles the day's work, dense information, detail, feedback and automation.
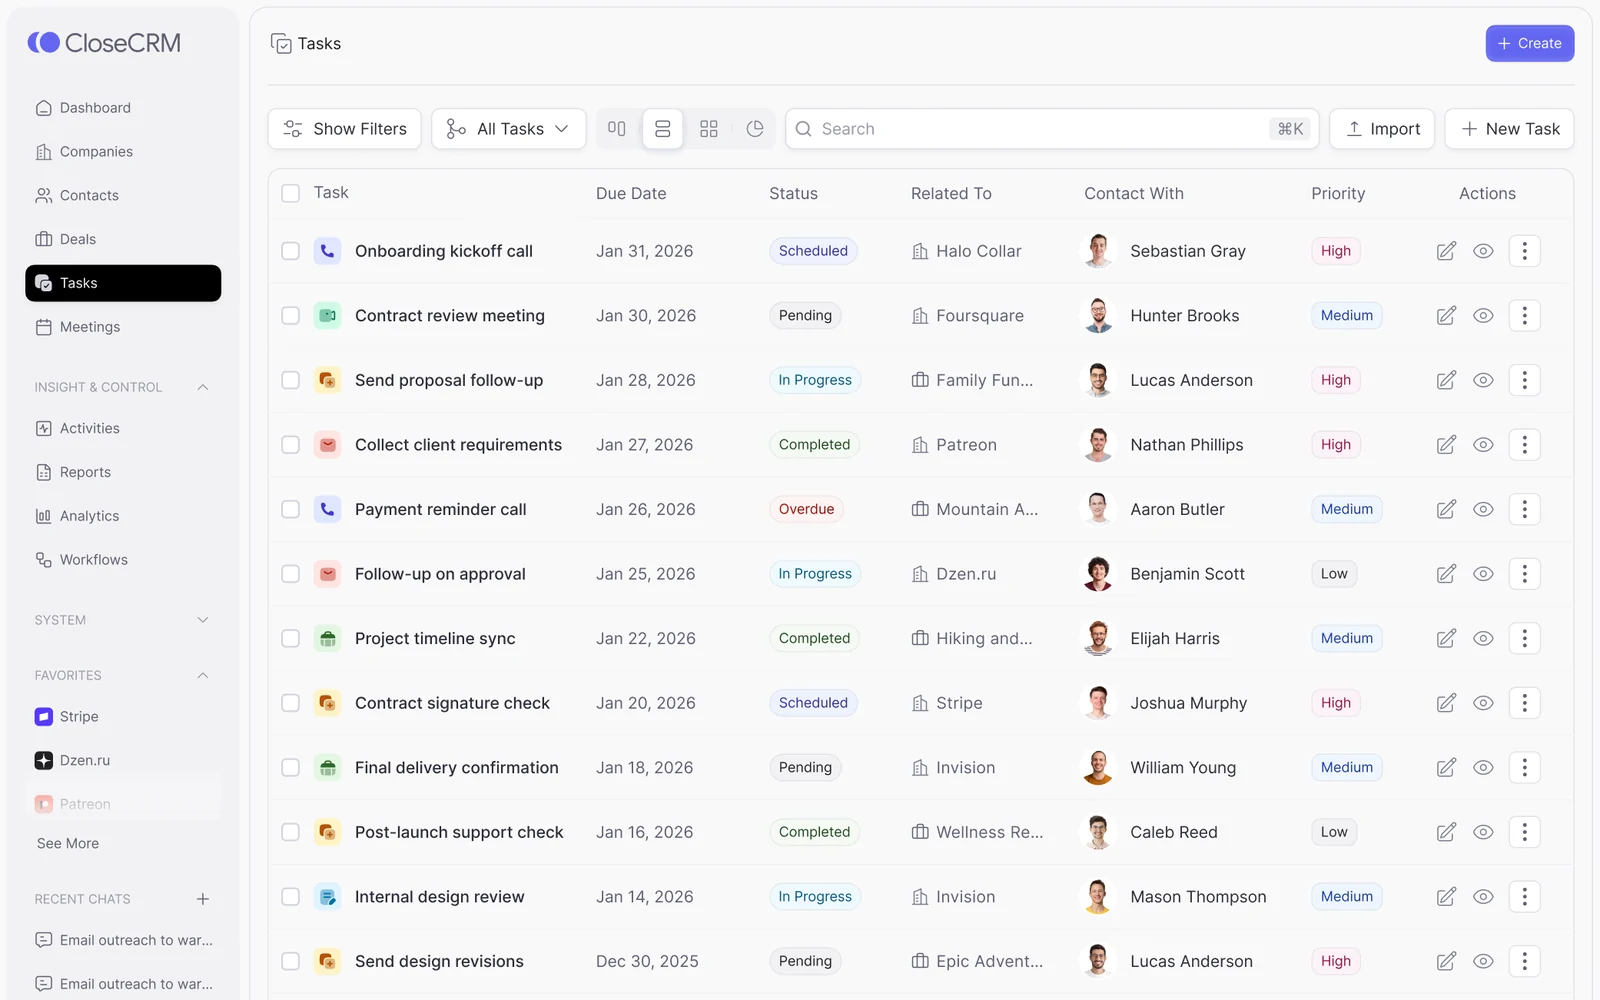
- Tasks
Where the day starts: one ranked task list.
Tasks carry a due date, status, related record, contact and priority in a single row, so a rep can pick the next action without opening anything.
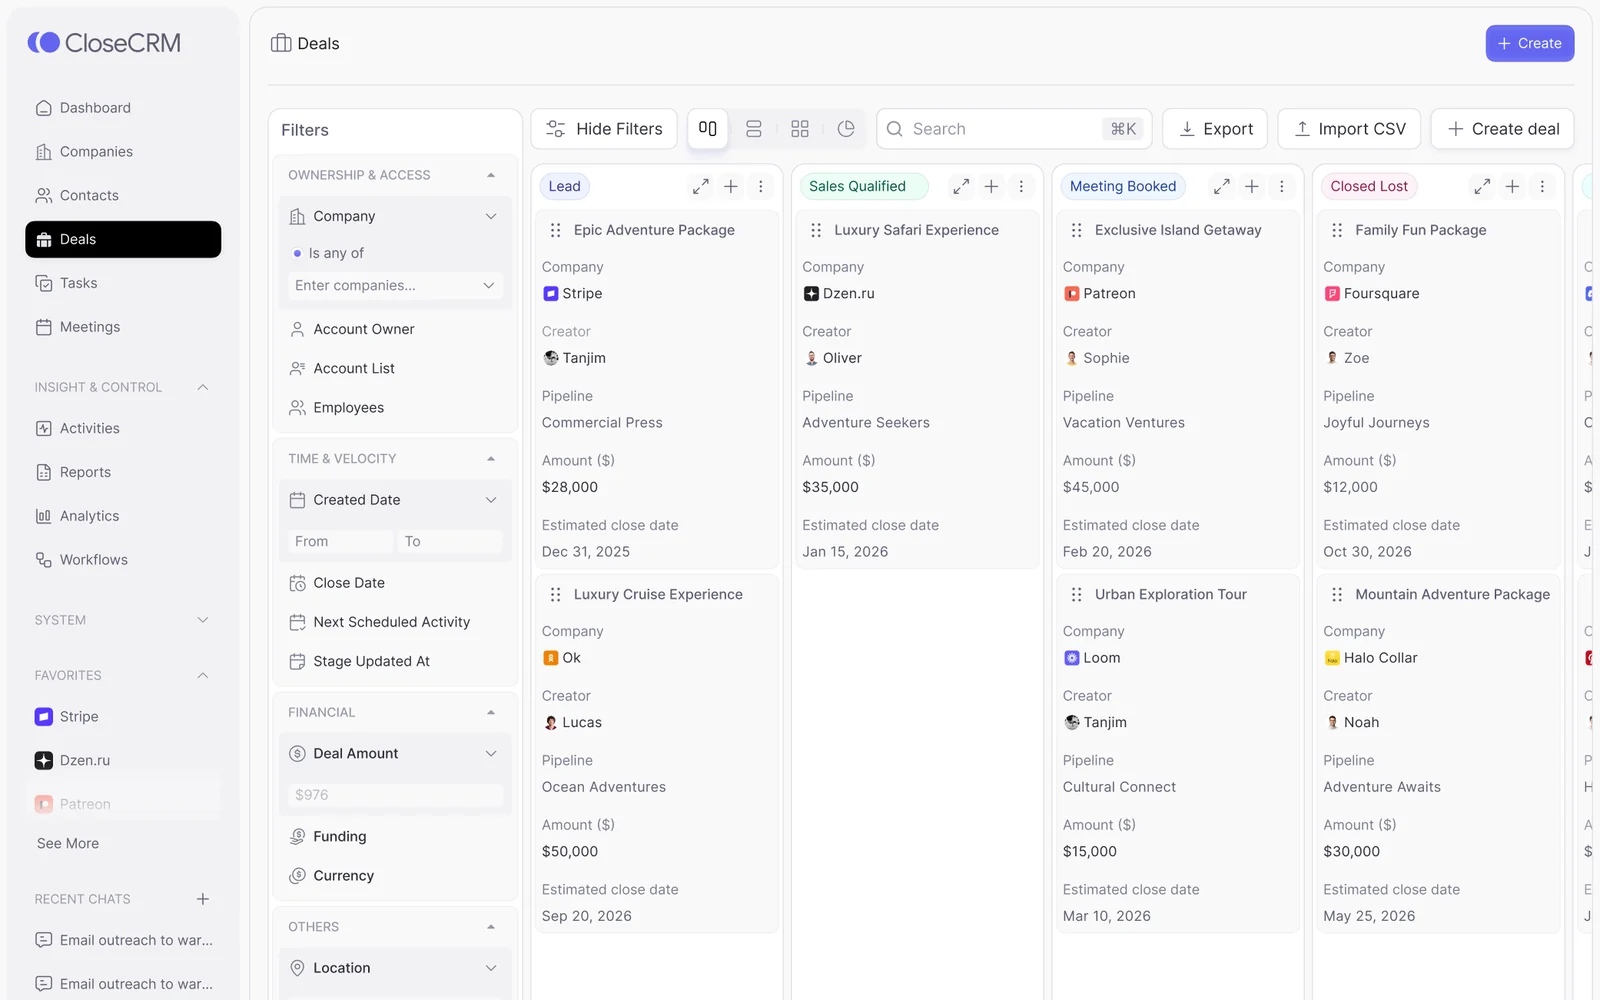
- Deals
Where decisions happen: the deal board.
Stage, amount and estimated close date are always visible. Filters narrow the board by owner, dates or deal value, so stuck deals are easy to find and review.
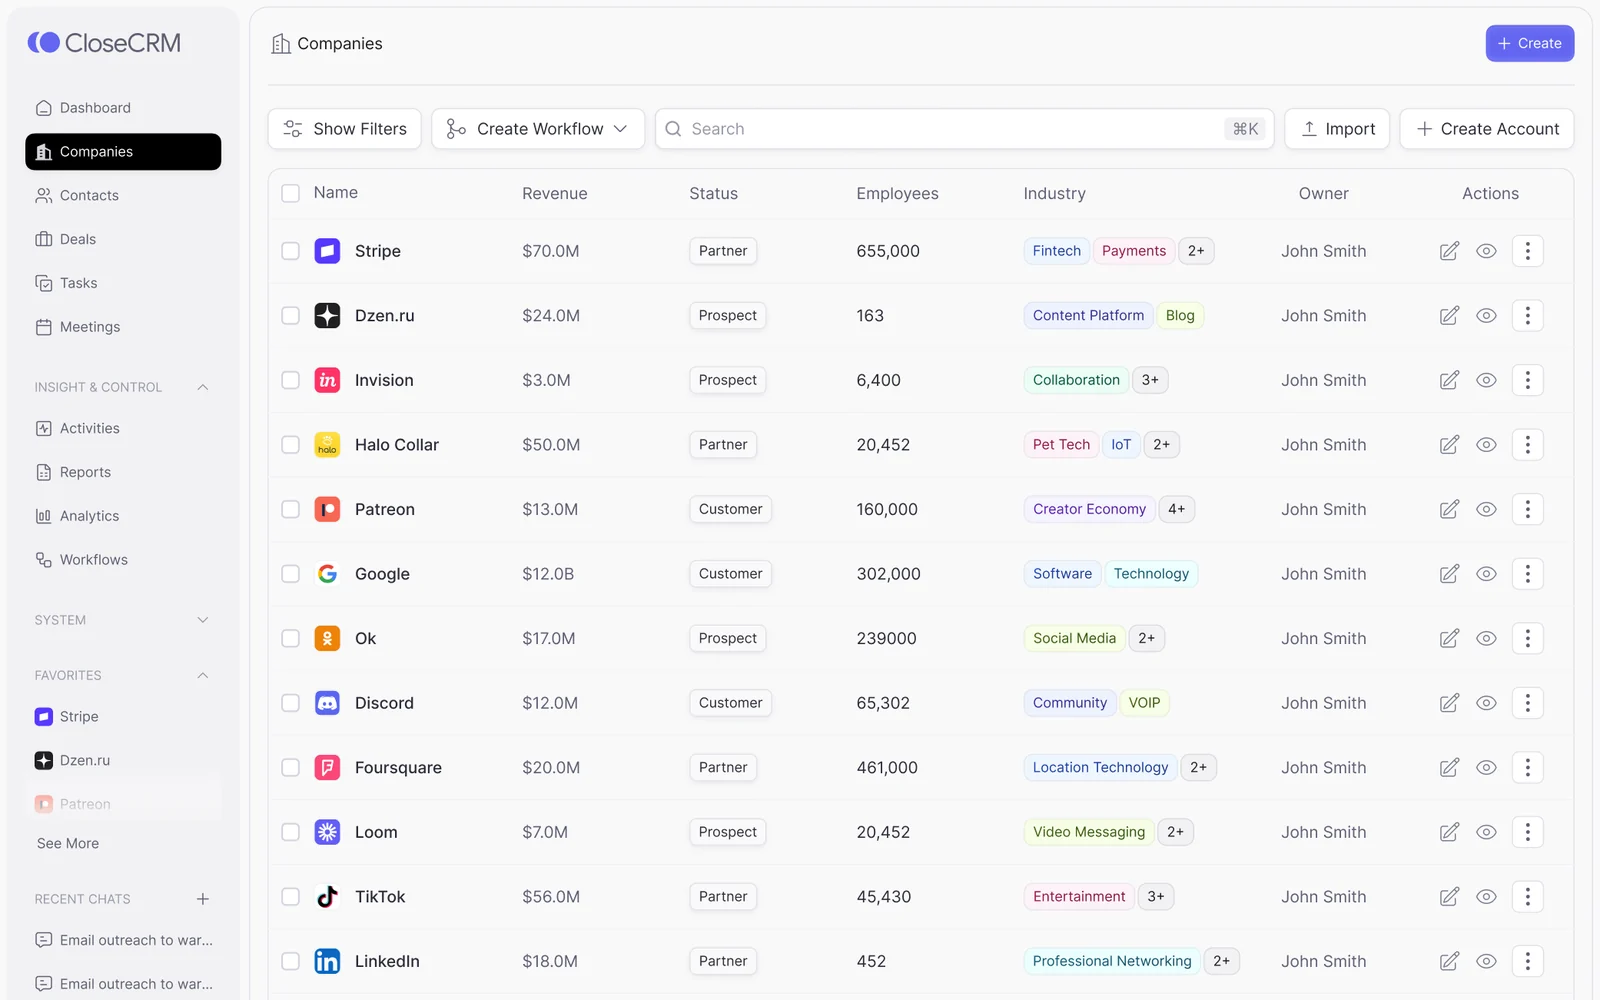
- Companies
A dense table that still scans.
Companies show revenue, relationship status, headcount, industry and owner per row. Overflowing tags collapse, and bulk tools share one toolbar.
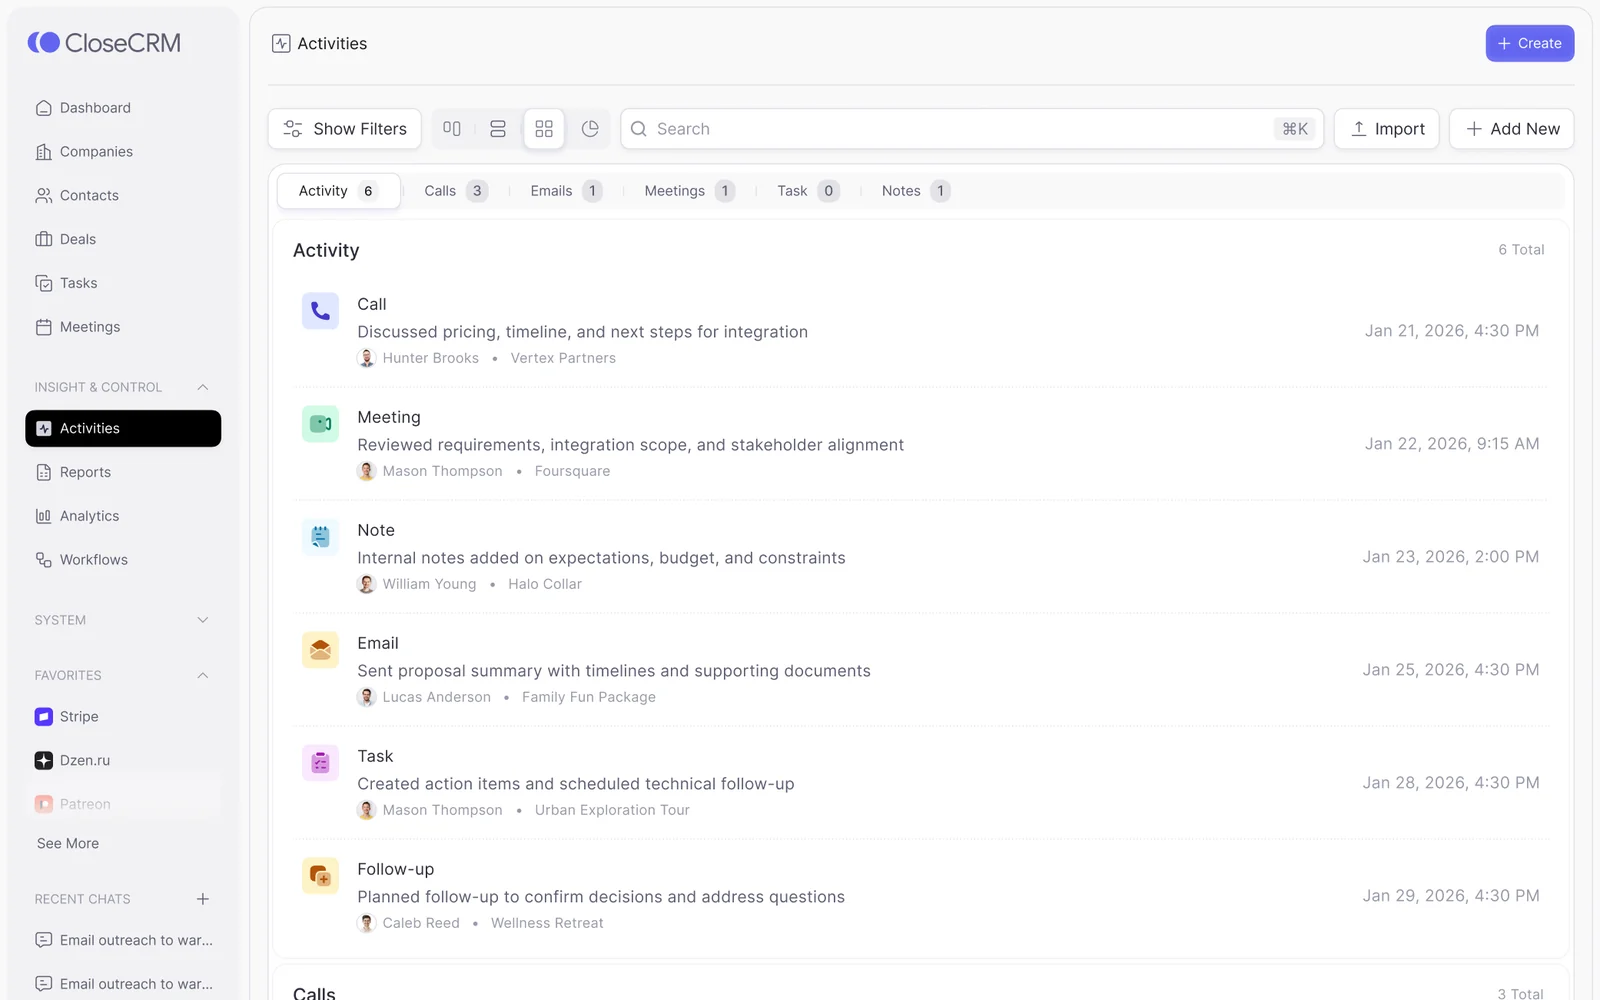
- Activities
Context lives in the record, not the overview.
Each activity names the contact, the related record and the time. Tabs count calls, emails, meetings, tasks and notes.
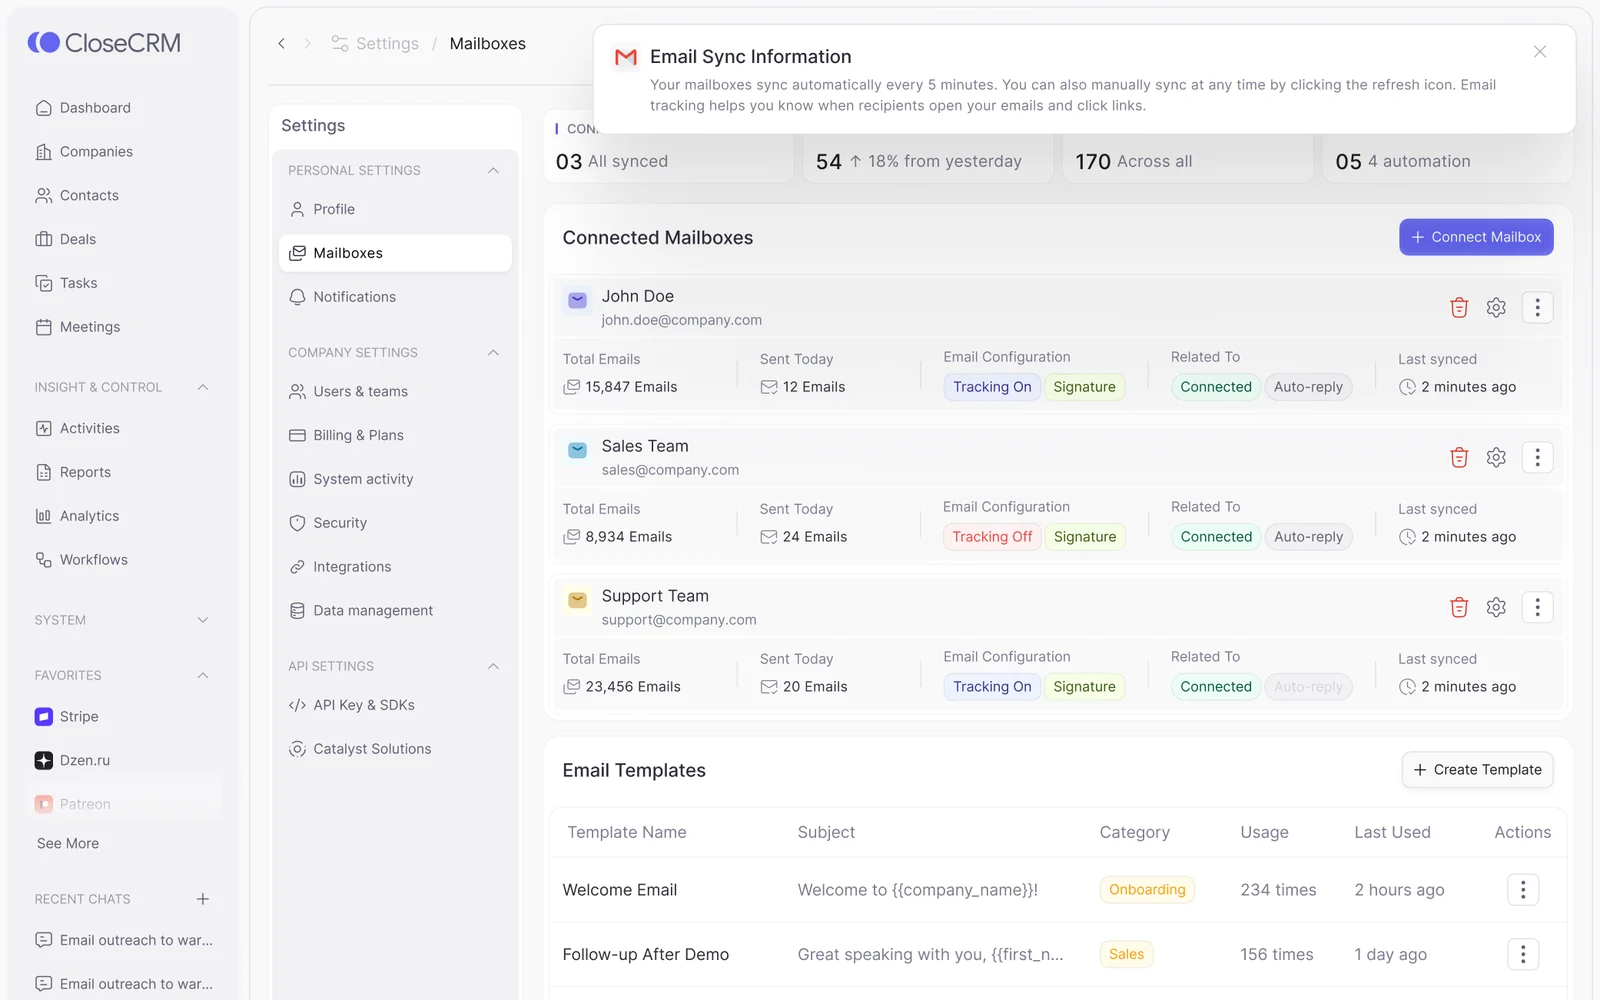
- Mailboxes
Feedback the user can trust.
Mailbox settings report sync, tracking and connection states openly, including when something is switched off.
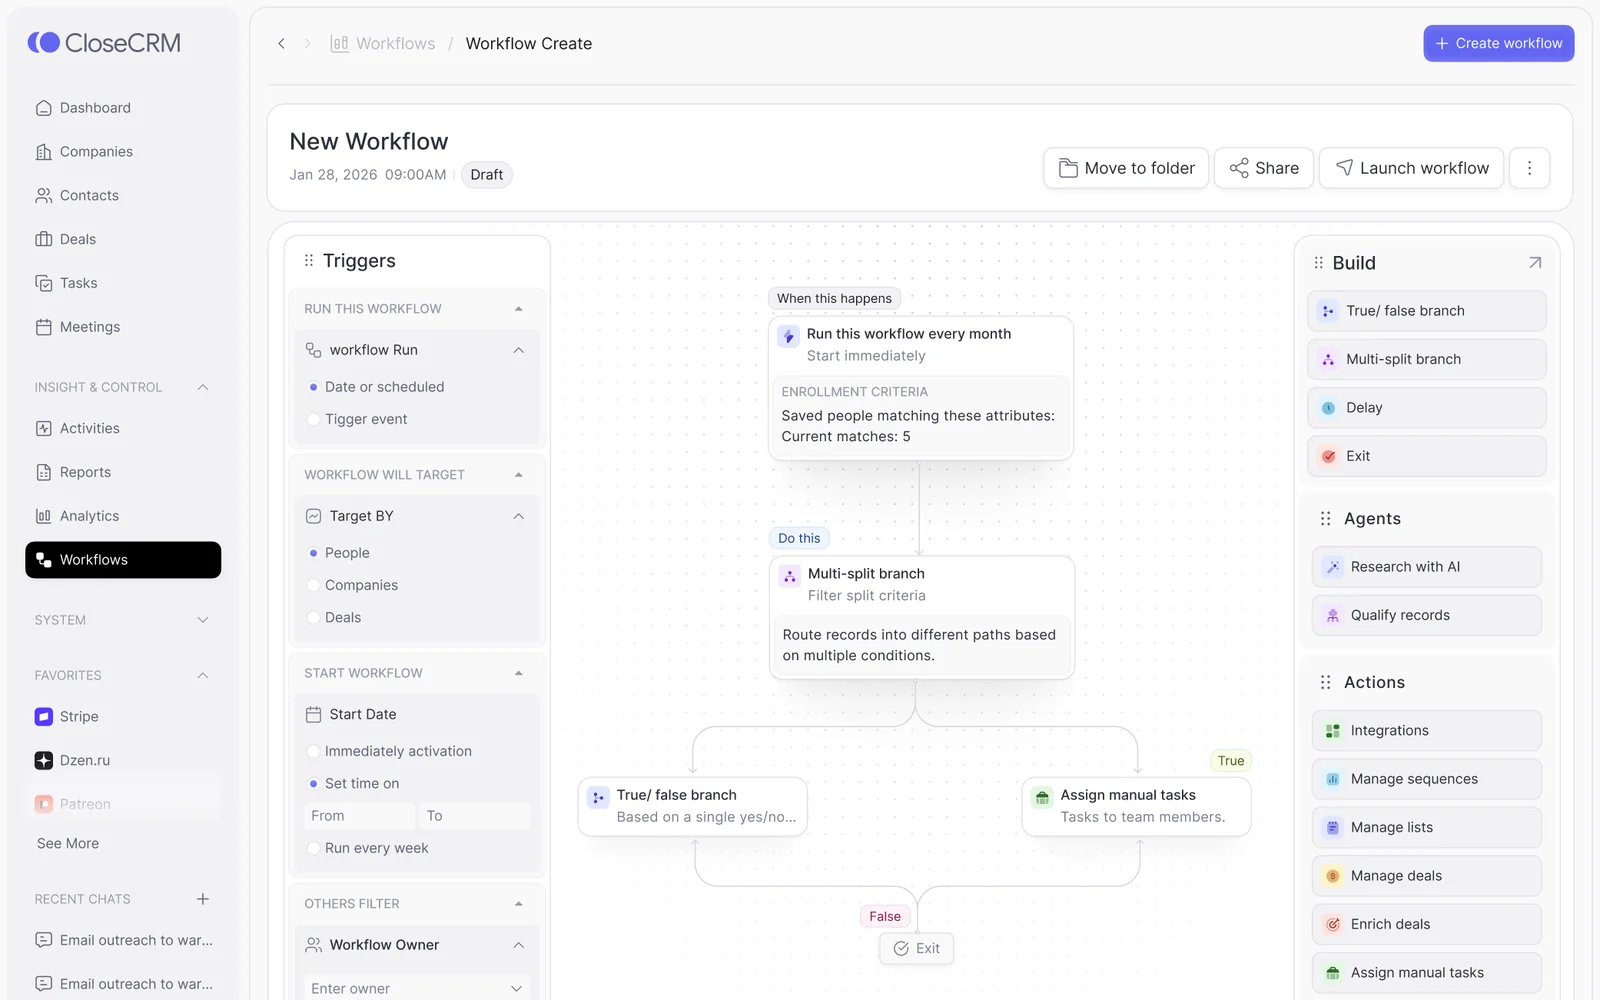
- Workflows
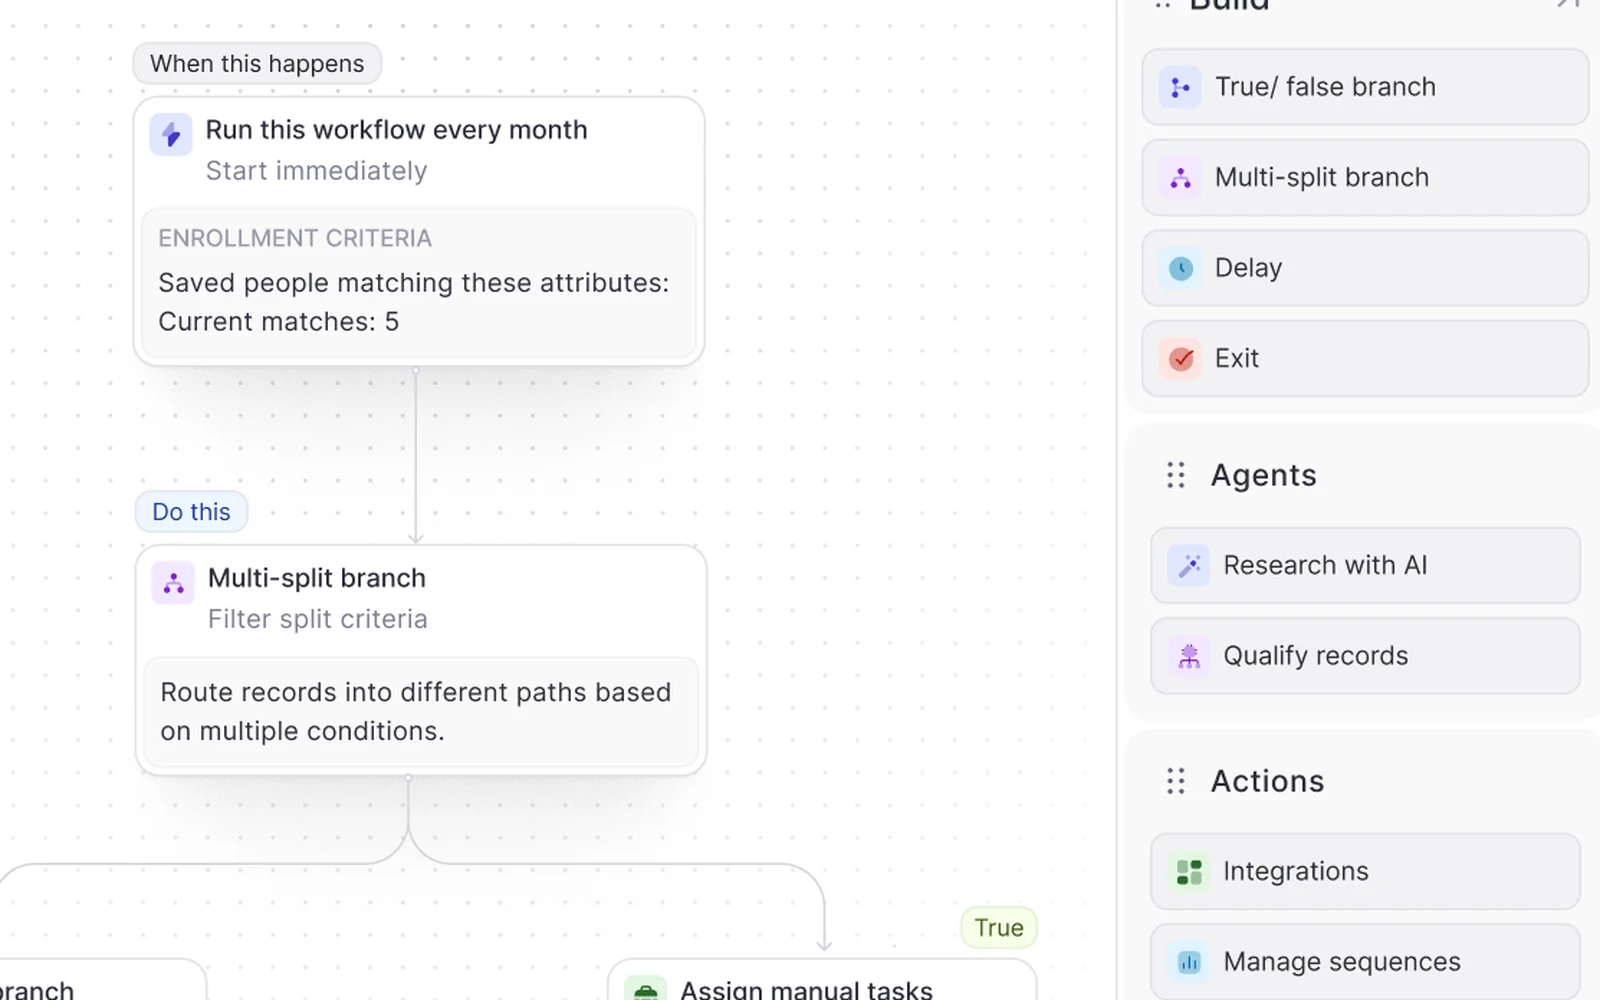
The moment of real work: building a workflow.
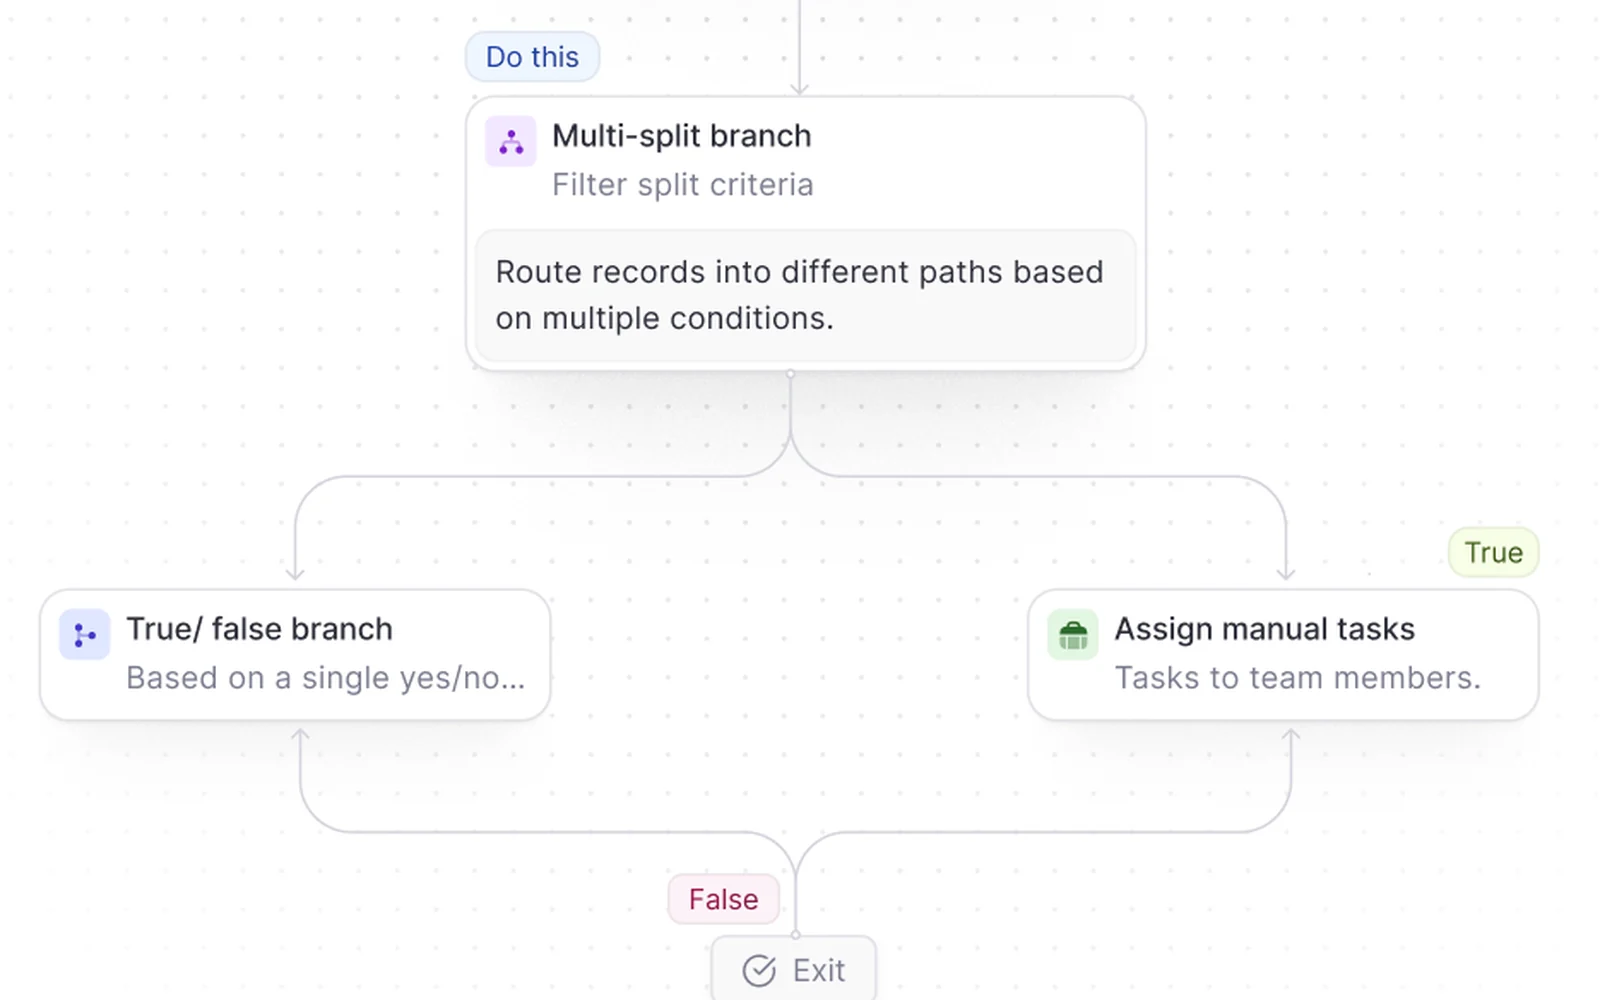
Triggers, targets and timing sit in a side panel. The canvas reads as sentences, “When this happens… Do this”, and new steps are dragged from a block library.
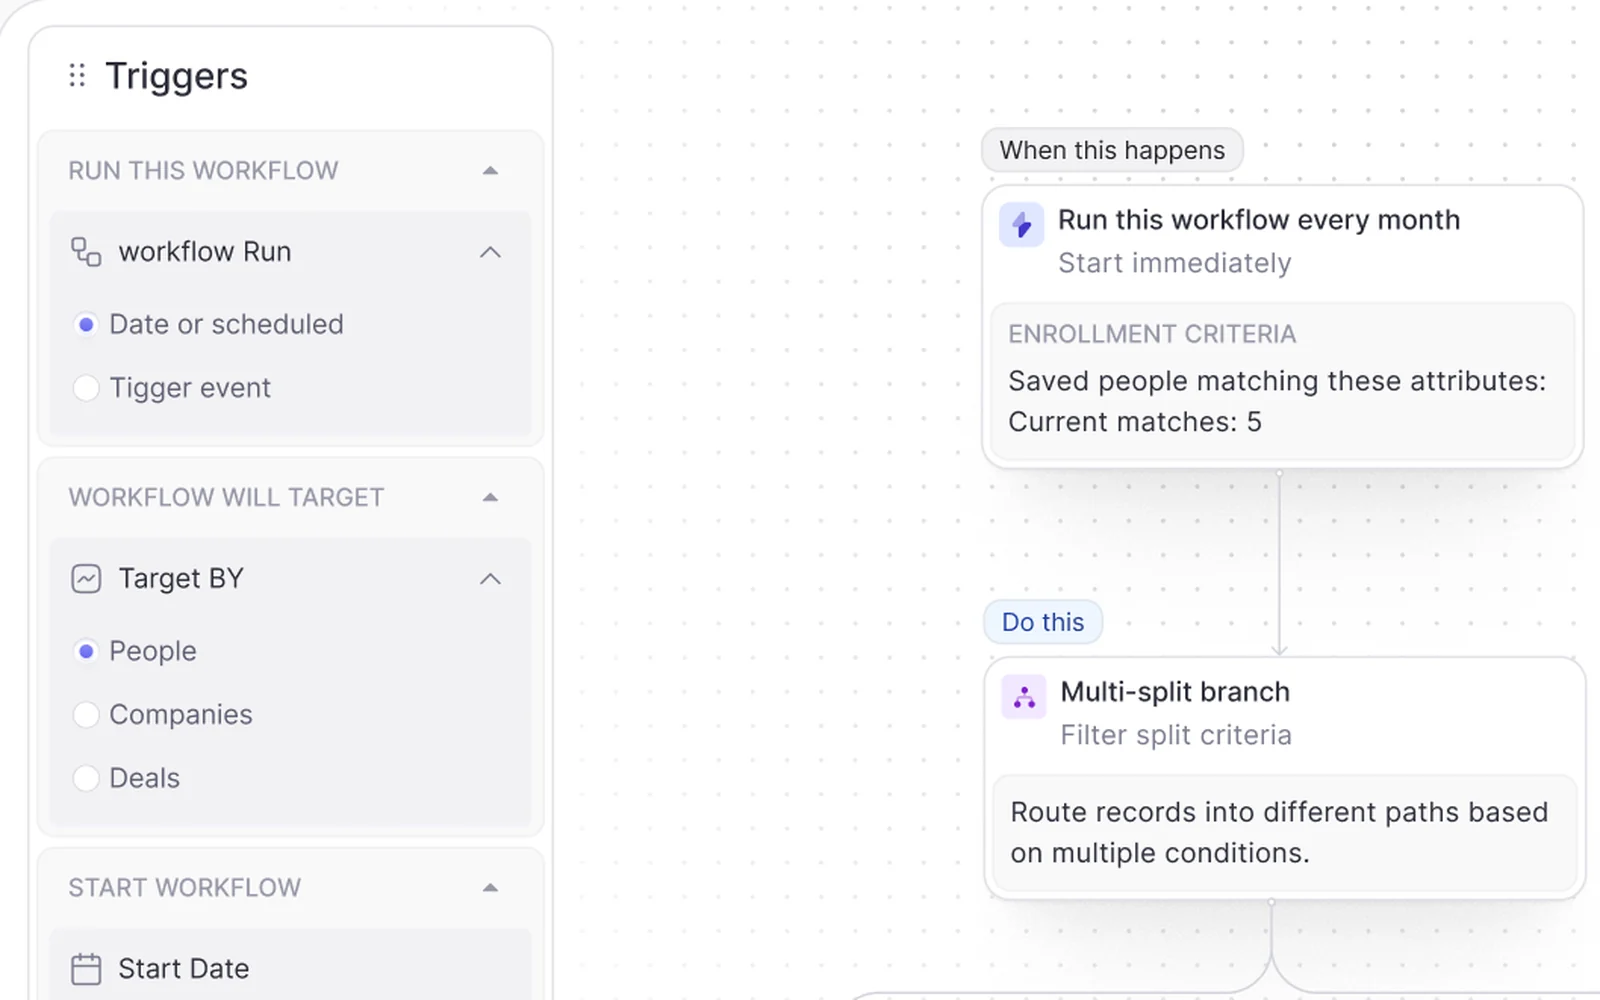
Interaction
Trigger, transition, result.
One workflow on the canvas, step by step.
Dark and light
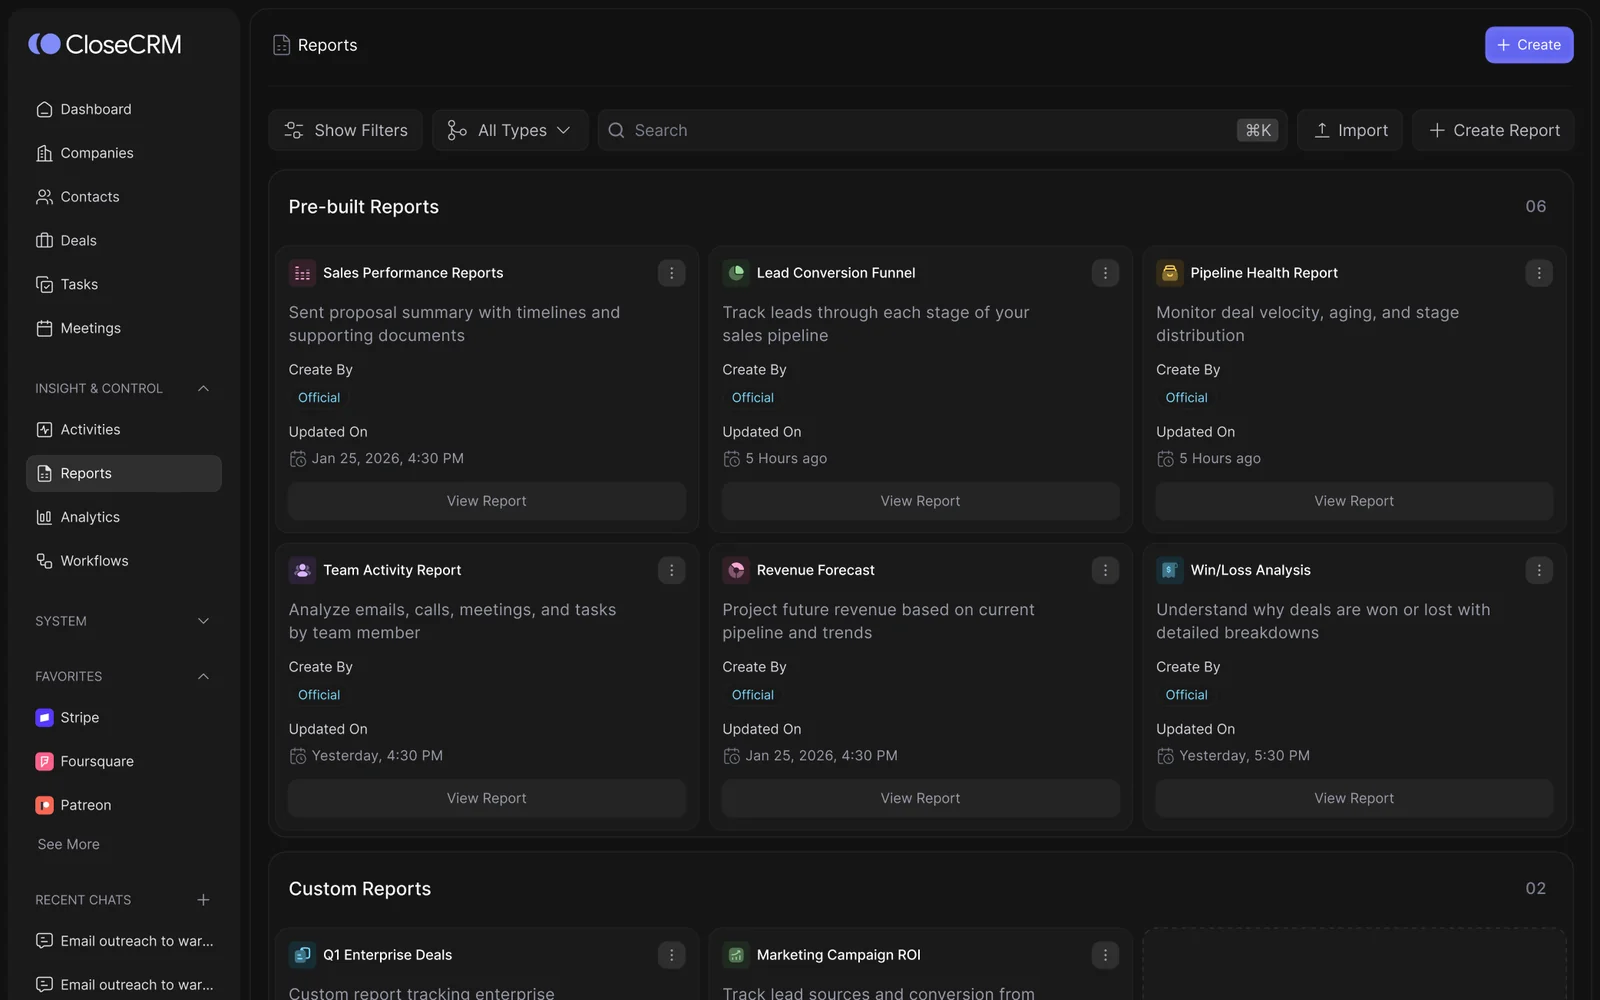
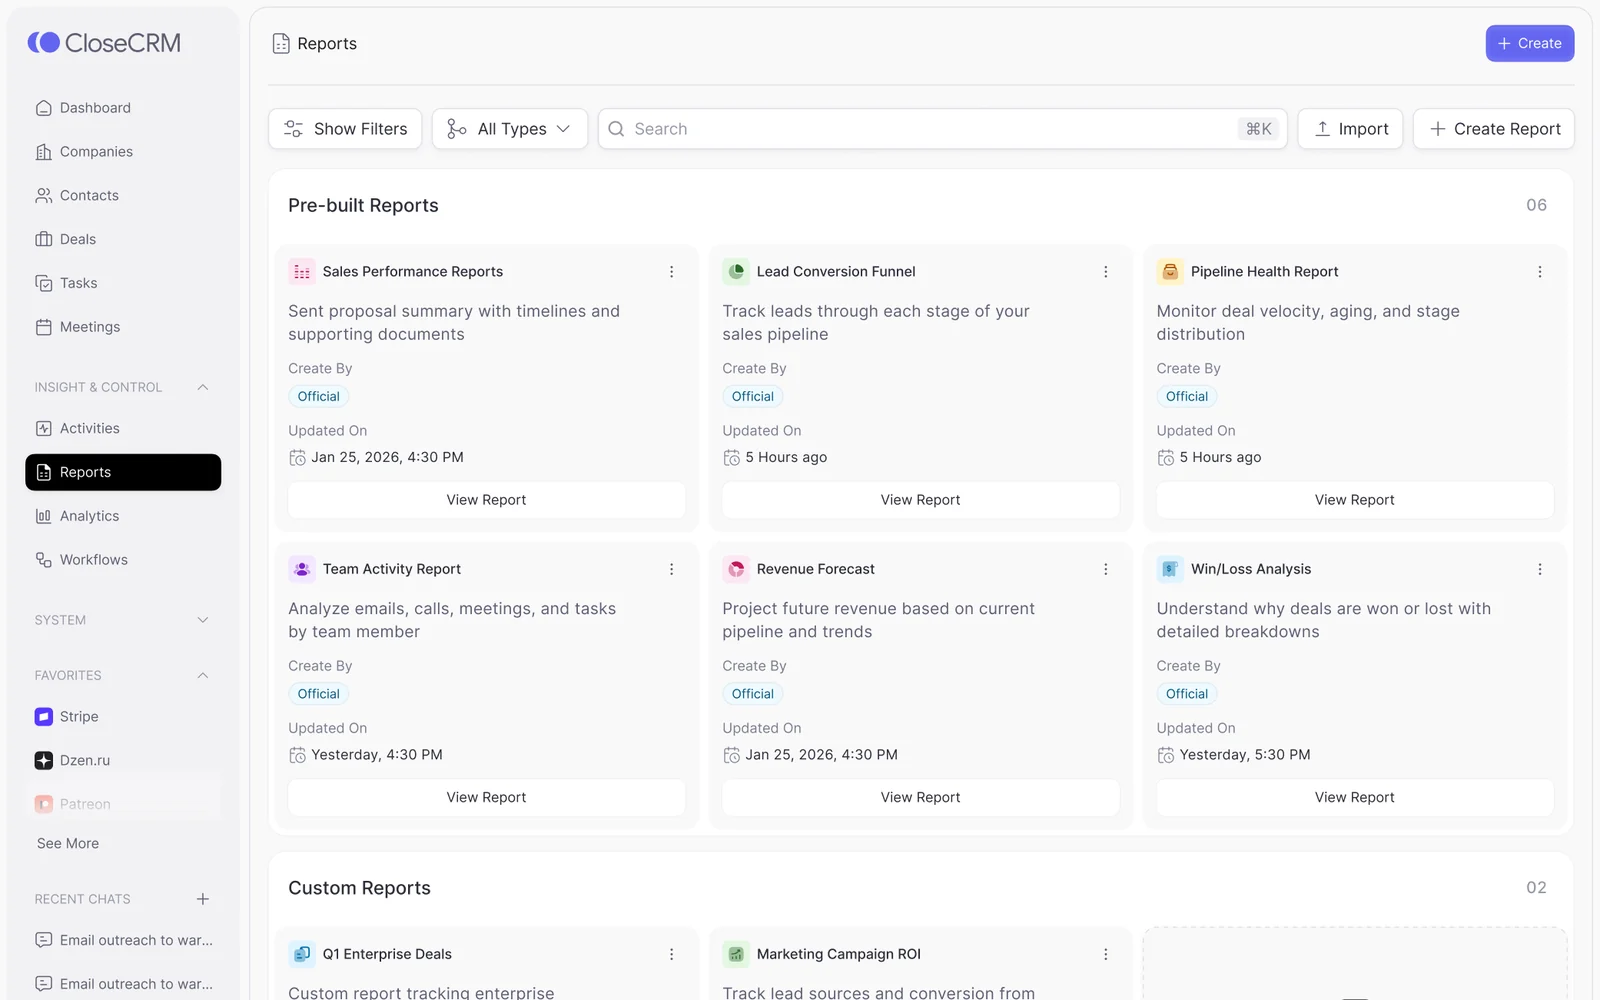
One design, both modes.
The same reports screen in light and dark. Drag to compare.
Style guide
Typography & colours.
A near-white base, three warm and cool accents for status and charts, and Periwinkle for the brand and primary actions.
White
HEX #FAFAFA
Periwinkle
HEX #8F8EFF
Sky Blue
HEX #8BCBFF
Warm Amber
HEX #F9BE5A
Warm Red
HEX #DD5A38
Inter
- Regular
- Medium
- SemiBold
- Bold
Every screen
Every screen, straight from the file.
Final designs from the product file, with demo data.
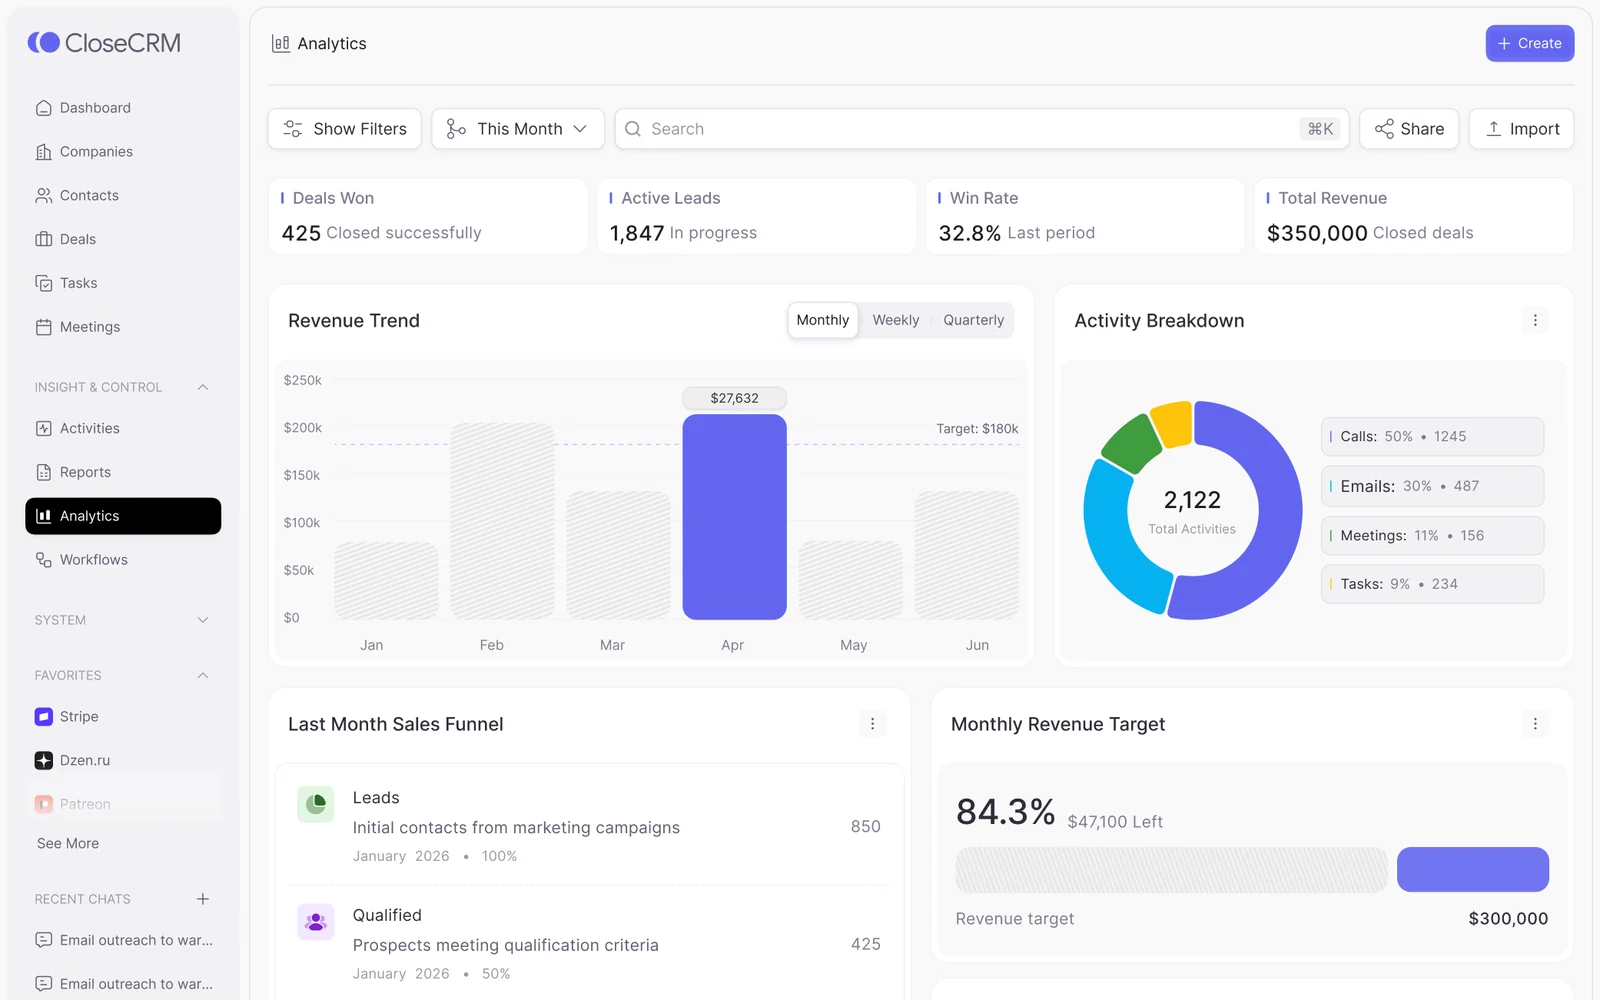
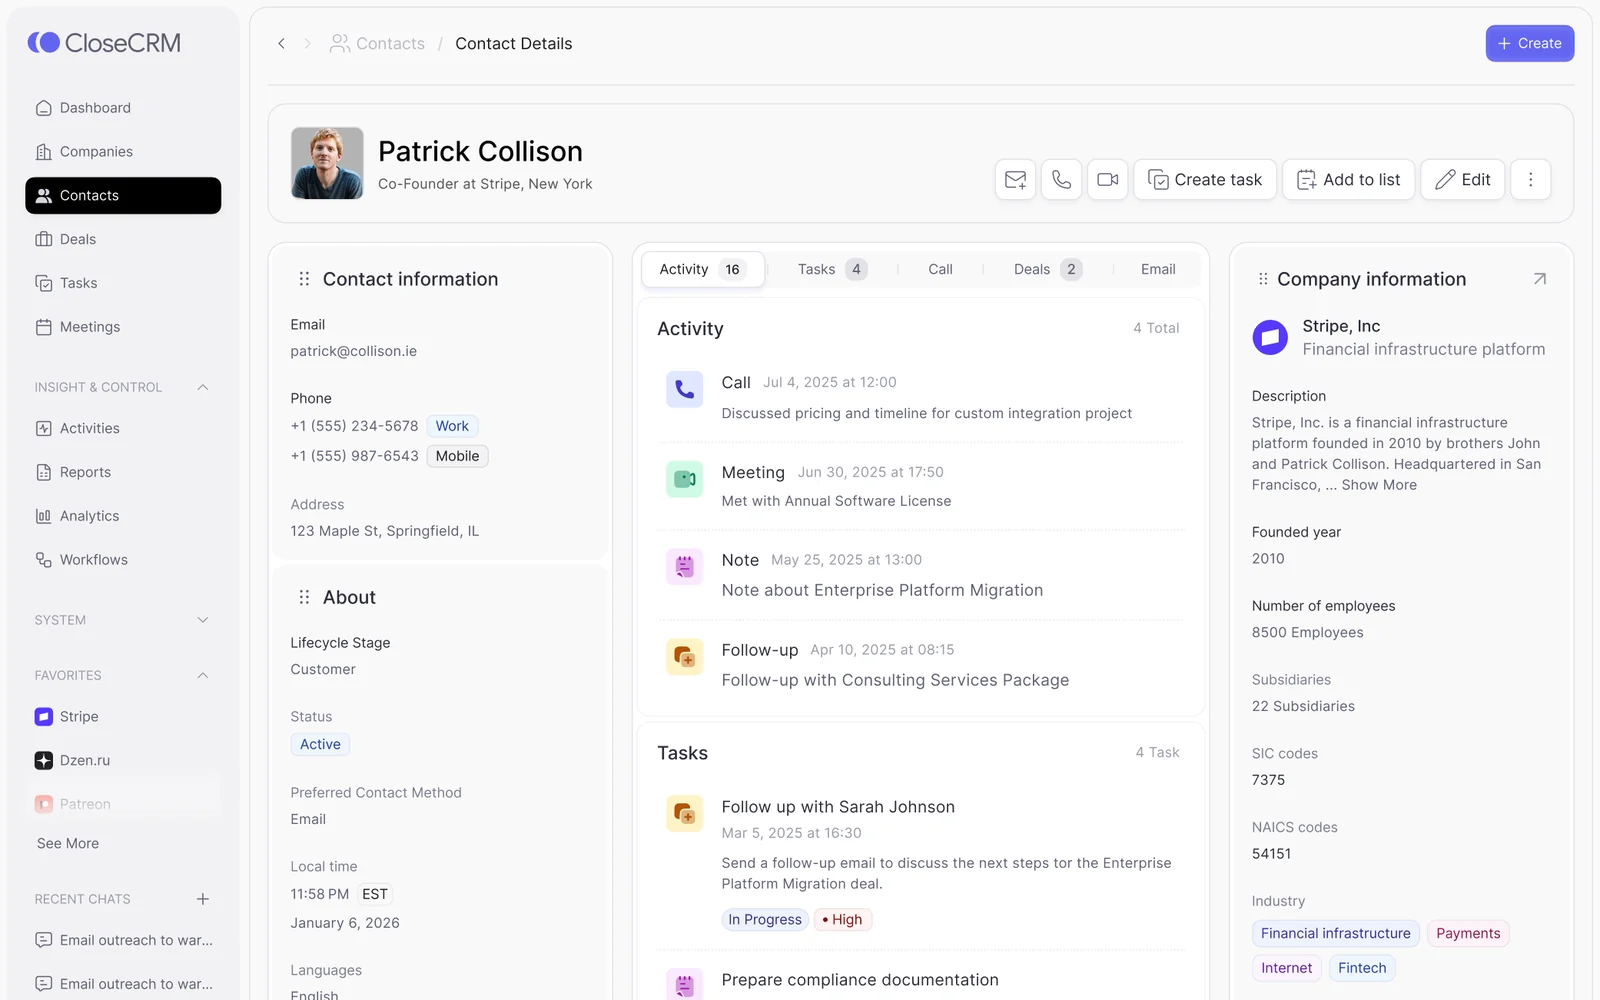
Analytics Contact record 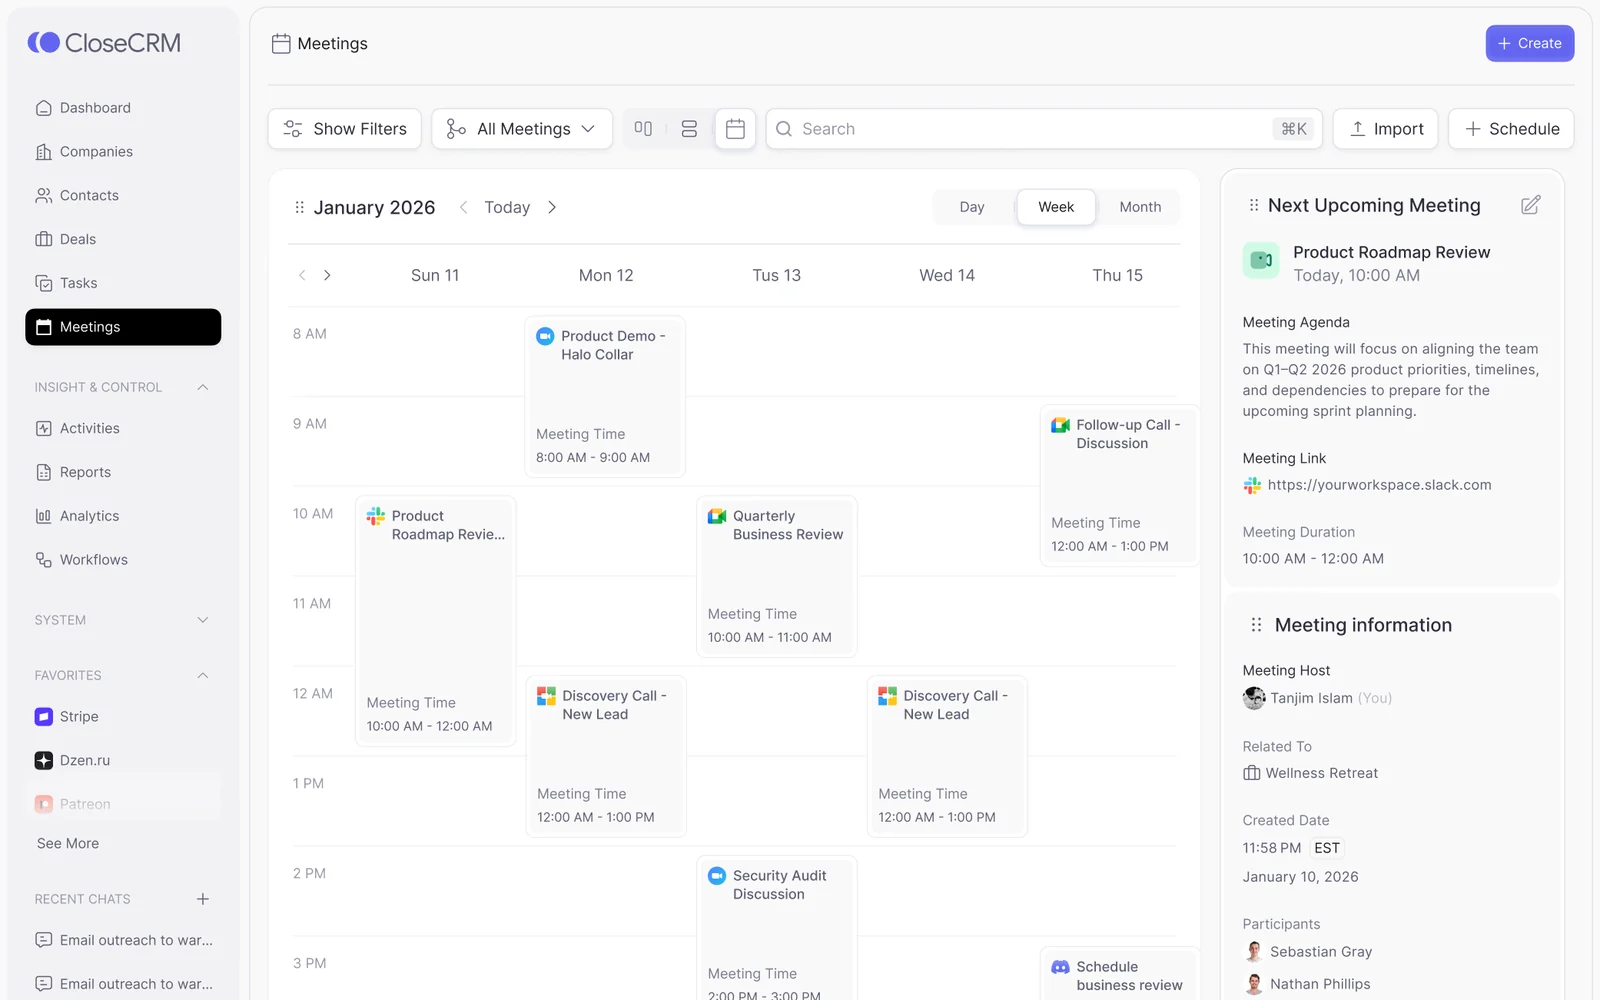
Meetings 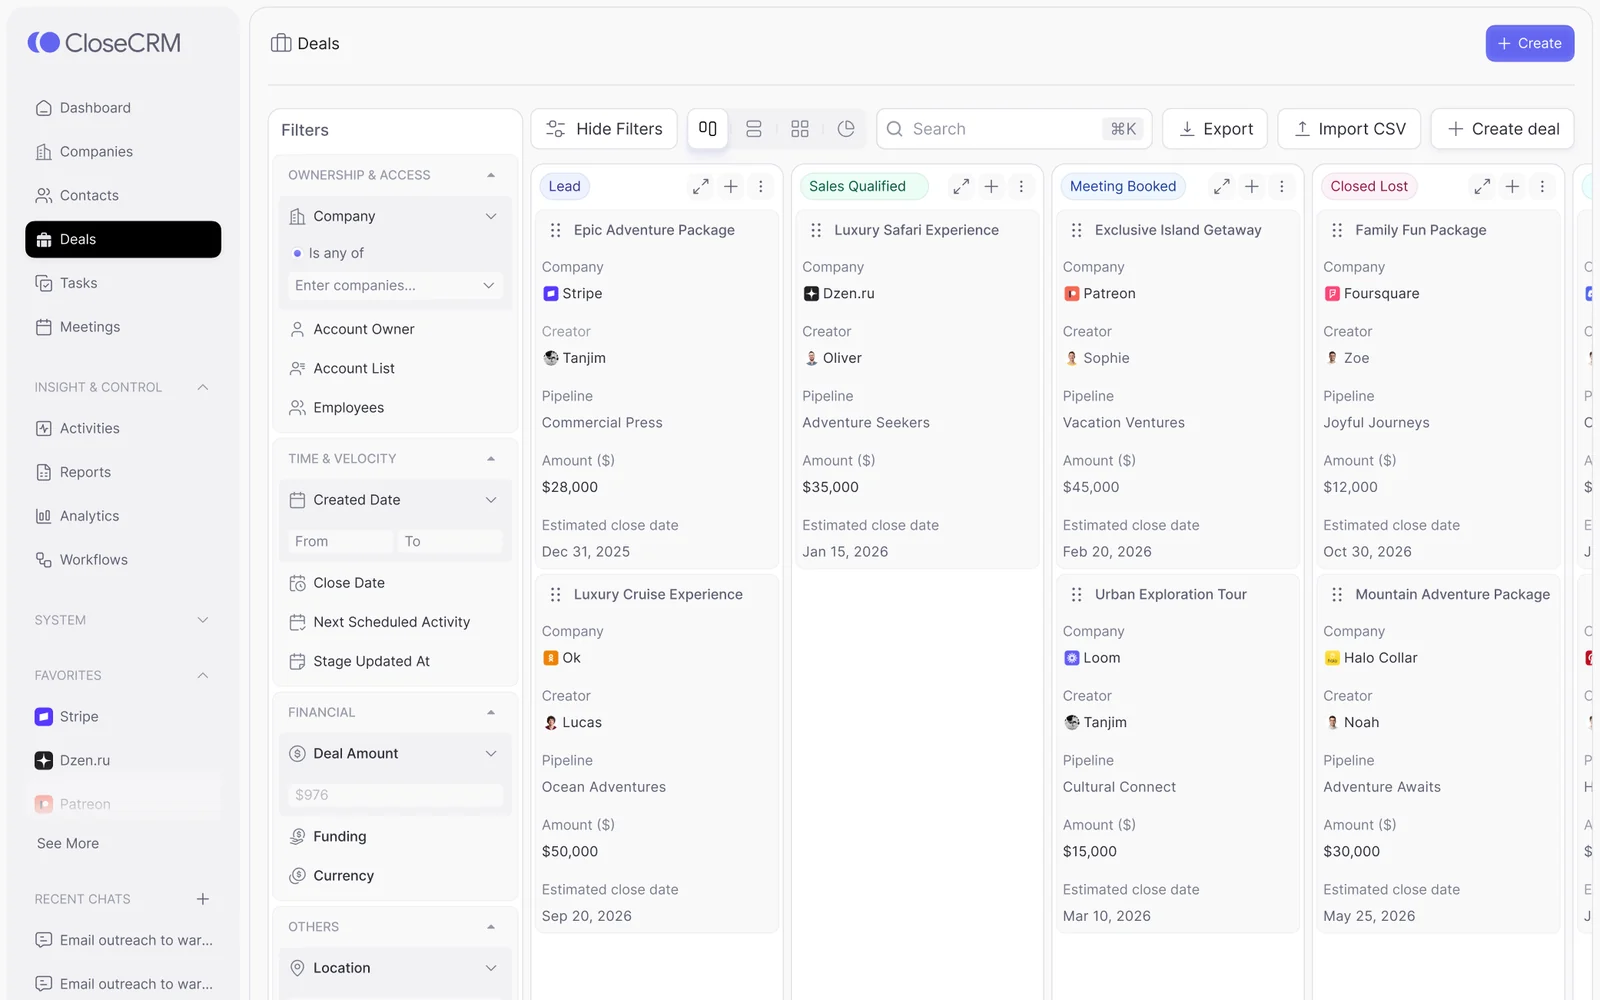
Deals Reports 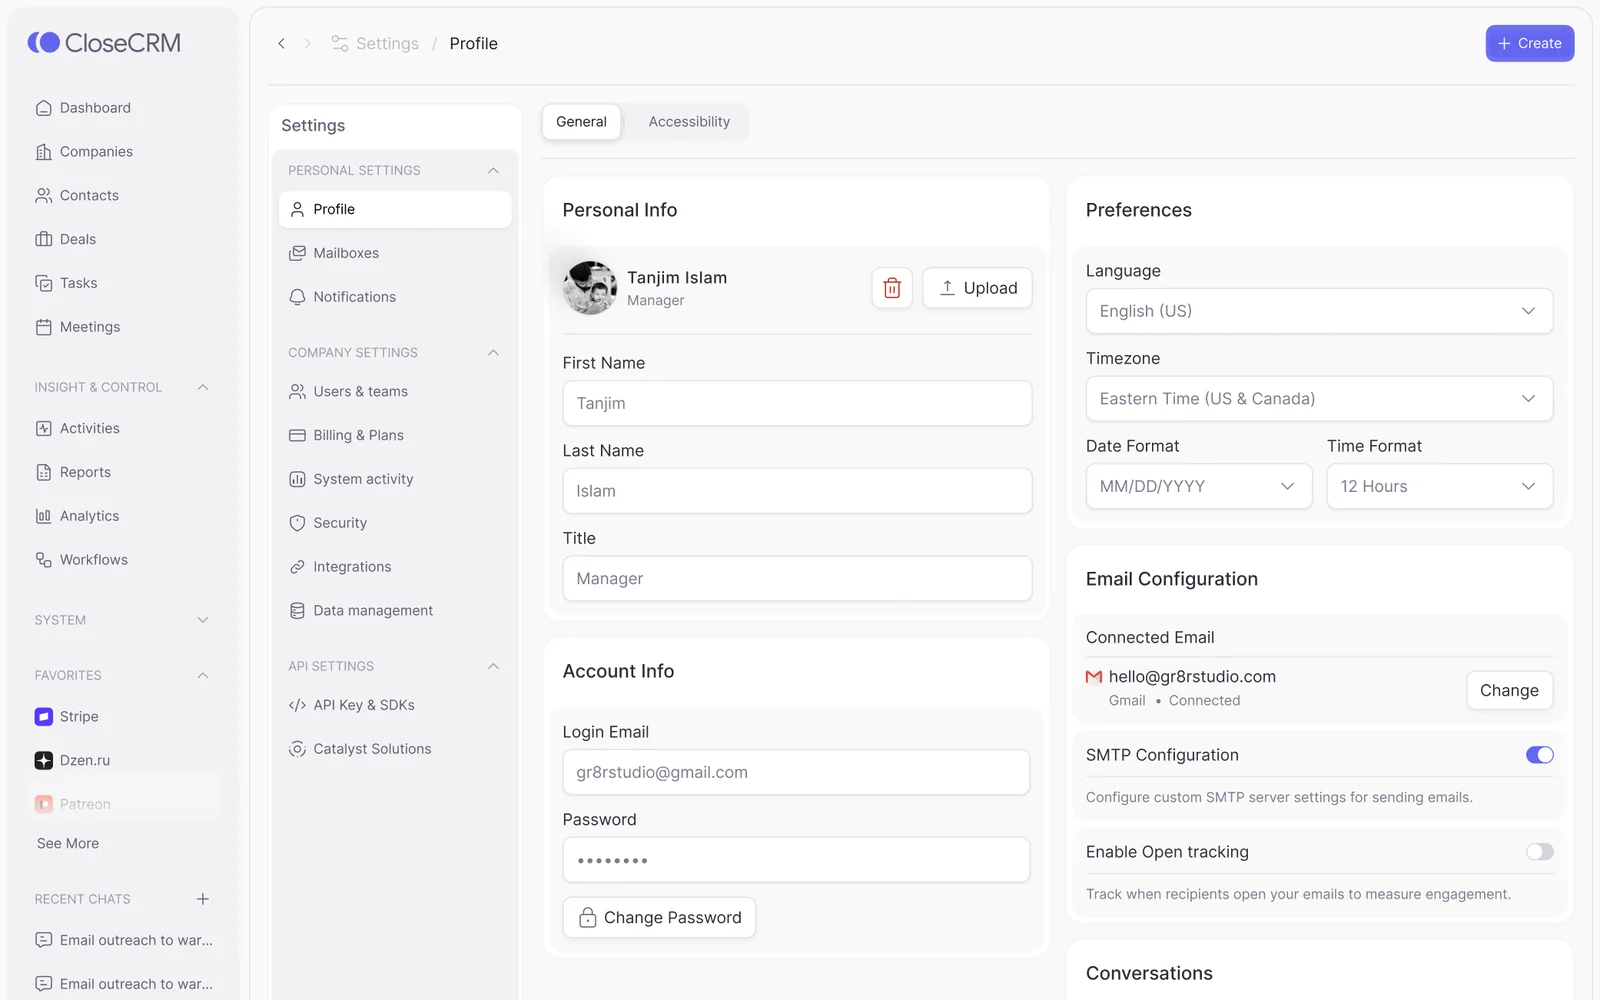
Profile settings
One data model
The same structured fields connect every screen.
The same structured fields connect every screen, which is what makes reporting and automation reliable. A company carries its revenue, status, industry and owner wherever it appears.
- Company: revenue, status, industry, owner
- One set of fields on every screen
- Reports and workflows read the same fields
Outcomes
Shipped in 62 days, ready to build.
What we delivered. Measured business results will be added only with evidence and approval.
62 days, 3 phases
From the brief to dev-ready files, across three phases.
Dev-ready Figma and prototype
Final screens, components and a clickable prototype the engineers build from.
A system in variables
Typography, colour and values set up as Figma variables, 144 colours among them.