


The UX Audit Report Template: What Each Page Should Hold

Tanjim Islam
Founder & CEO · · 6 min read


This is the template we would hand a team that wants to run its own audit. Every section is in the post, so you can copy it now. If you want the audit done for you, Gr8r offers a free UX audit to the first 5 companies that ask. For what an audit is in the first place, read what a UX audit is.
What makes a UX audit report useful?
A report is useful when the person who reads only page one still knows what to fix first.
Most reports fail in one of two ways. Some are forty pages of prose with no ranking. Others are a spreadsheet of a hundred rows where a typo sits next to a broken checkout. Both leave your team guessing.
A good template forces three habits: every finding has evidence, every finding has a severity, and the fix plan puts the work in order.
What sections does the template have?
Five sections, plus an appendix.
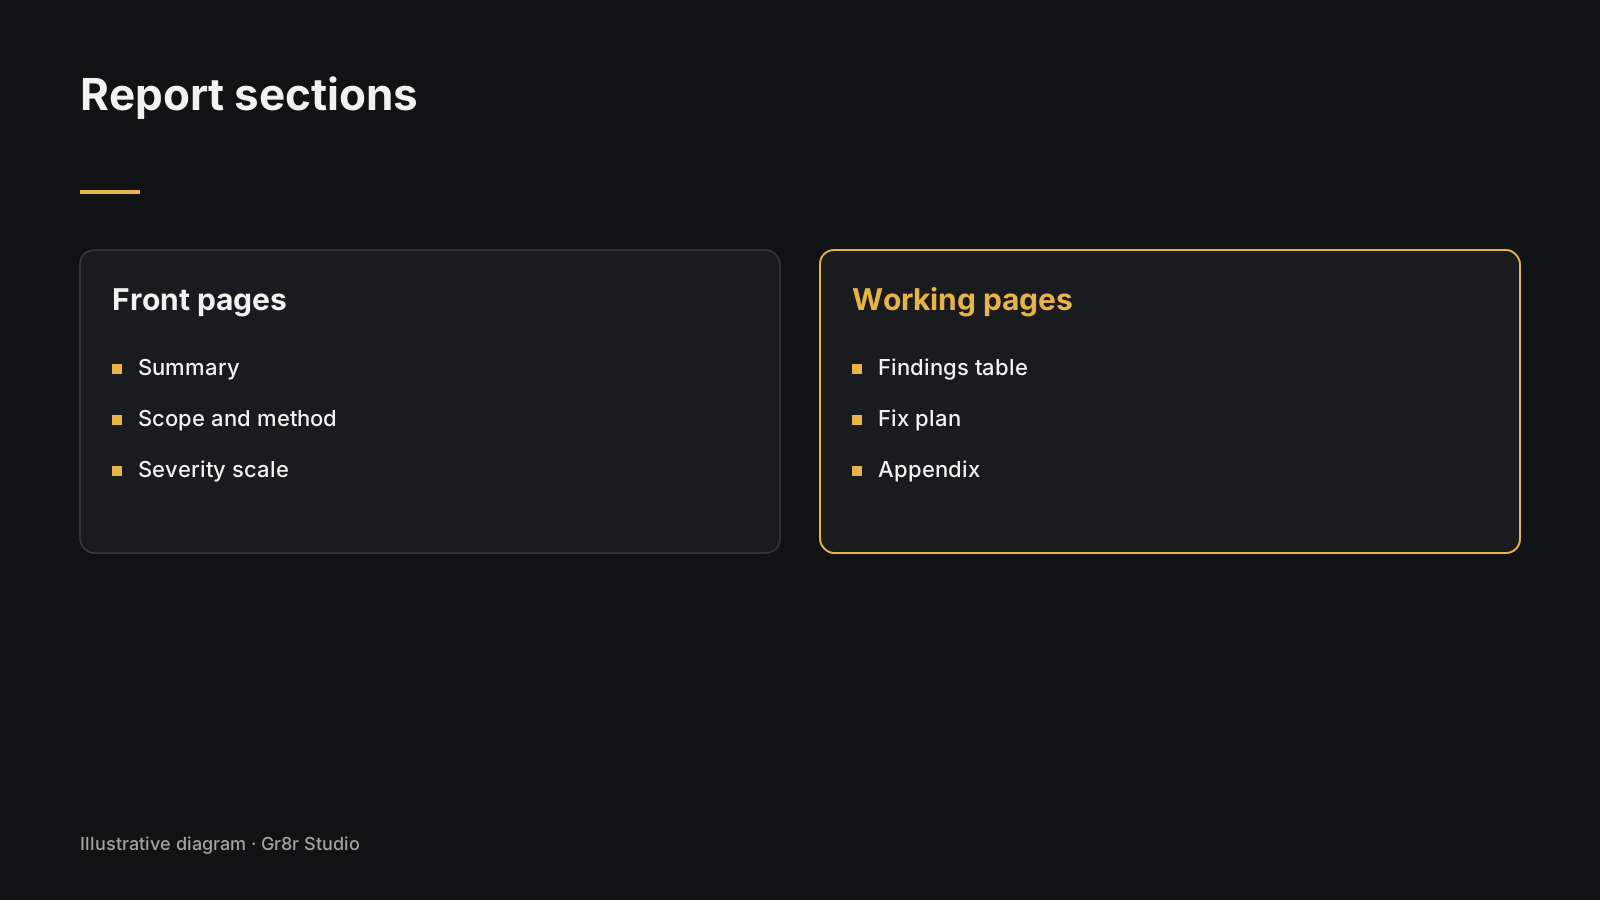
Page 1: Summary
This page is for the founder or head of product with five minutes between calls. It holds:
- What was reviewed, in one sentence. For example: "Sign up and first project setup, on mobile and desktop."
- The three to five problems that matter most, one line each, with a severity.
- The count: total findings, how many are a 4, how many are a 3.
- The direction: small fixes, rework one flow, or redesign.
Page 2: Scope and method
This page stops arguments later. It holds:
- Tasks reviewed: the two to four user tasks, written as goals. "Create a first invoice", not "Invoices page".
- Devices and browsers: which phone, which desktop browser.
- Data used: analytics range, number of support tickets read, recordings watched.
- Rules used: for example Jakob Nielsen's ten usability heuristics and an accessibility check against WCAG.
- Reviewers: how many people reviewed independently. The Nielsen Norman Group recommends that "three to five people should independently evaluate the same interface" (NN/g, How to Conduct a Heuristic Evaluation, 25 June 2023, fetched 25 Oct 2026).
- Out of scope: what you did not look at.
Page 3: Severity scale
Define the scale on its own page so nobody reads a 3 as "pretty bad". This template uses Jakob Nielsen's 0 to 4 scale (NN/g, Severity Ratings for Usability Problems, 1 November 1994, fetched 25 Oct 2026), with a plain action column we added:
| Score | Nielsen's meaning | What it means for your team |
|---|---|---|
| 0 | I don't agree that this is a usability problem at all | Drop it from the report |
| 1 | Cosmetic problem only | Fix when someone is already in that file |
| 2 | Minor usability problem | Plan it for this quarter |
| 3 | Major usability problem | Put it in the next sprint |
| 4 | Usability catastrophe | Fix before the next release |
Nielsen scores severity on three things: how often it happens, how hard it is to get past, and whether it keeps happening. Write those three on this page too.
Pages 4 onward: Findings table
The heart of the report. One row per problem.
| ID | Task | Screen | What the user hits | Evidence | Rule broken | Freq | Impact | Severity (0 to 4) | Fix | Effort (S, M, L) | Owner |
|---|---|---|---|---|---|---|---|---|---|---|---|
| F01 | |||||||||||
| F02 | |||||||||||
| F03 |
What each column holds:
- ID: a short code so people can say "F07" in a meeting.
- Task: which user task this sits in.
- Screen: the page or state, with a link or screenshot number.
- What the user hits: one sentence in the user's words. "I tapped Save and nothing told me it worked."
- Evidence: screenshot with the problem circled, a ticket quote, an analytics drop or a recording time.
- Rule broken: the heuristic or accessibility rule.
- Freq and Impact: high, medium or low. These feed the severity.
- Severity: the 0 to 4 score from page 3.
- Fix: what to change, specific enough to build.
- Effort: small, medium or large, agreed with an engineer.
- Owner: a name, not a team.
Here is an illustration, not a real client. One filled row:
| ID | Task | Screen | What the user hits | Evidence | Rule broken | Freq | Impact | Severity | Fix | Effort | Owner |
|---|---|---|---|---|---|---|---|---|---|---|---|
| F01 | Pay an invoice | Checkout, mobile | The Pay button sits under the keyboard, so I can't see it | Screenshot 14; 9 tickets in a month mention "can't pay" | Visibility of system status | High | High | 4 | Pin the Pay button above the keyboard; close the keyboard on Done | S | Design lead |
Fix plan page
Sort the findings by severity and effort into four groups:
- Fix now: severity 3 or 4, small effort.
- Fix next: severity 3 or 4, larger effort. Plan it.
- Bundle: severity 1 or 2, small effort. Do it when someone is in that area.
- Park: severity 1 or 2, large effort. Write it down and move on.
End the page with a date for a follow up check.
Appendix
- The full list of screens reviewed.
- Raw notes from each reviewer.
- Findings you noticed but that sit outside scope.
- Tools used to collect evidence.
How do you fill the template without fooling yourself?
Score after you review, merge duplicate findings, use more than one reviewer if you can, and write each fix so an engineer can start on it.
- Score after you review, not during. Find problems first. Rate them later, in one sitting, so the scale stays steady.
- Merge duplicates. The same vague button label on six screens is one finding with six locations.
- Use more than one reviewer if you can. Nielsen wrote that "severity ratings from a single evaluator are too unreliable to be trusted." If you are alone, say so on page 2.
- Write the fix so an engineer can start. "Improve the form" is not a fix. "Move the company size field after the first project is created" is.
Here is how a finding reads against a real page. Orbital, an operations product Gr8r built, opens with "Your entire operation, live on one map." and two buttons, "Enter operations center" and "View demo". A reviewer would log which button a first time visitor should press and whether the page makes that clear. Built by Gr8r for its own portfolio. Not client work.
Does Gr8r offer UX audits?
Yes. Gr8r offers a free UX audit to the first 5 companies that ask. Sample findings in our own posts are drawn on our in house builds or labeled illustrations, never on a client without sign off.
Frequently asked questions
What should a UX audit report include?
A one page summary, the scope and method, the severity scale you used, a findings table with screen, problem, evidence, severity and fix for each row, and a fix plan that puts the work in order.
What severity scale should a UX audit use?
A common choice is Jakob Nielsen's 0 to 4 scale: 0 not a problem, 1 cosmetic, 2 minor, 3 major, 4 catastrophe. Pick one scale, define it on its own page, and use it for every finding.
How long should a UX audit report be?
Short at the front and complete at the back. Keep the summary to one page. Put every finding in the table, and move raw notes and the full screen list to an appendix.
Should findings be grouped by page or by problem?
Group by problem type or by task when you can. The same weak label on six screens is one finding with six places to fix, not six findings.
Can I get the template as a file?
The downloadable file is coming. Until then, copy the sections and table from this post into your own doc or spreadsheet.
About the author
Tanjim Islam is the founder and CEO of Gr8r Studio. He founded the studio in 2023. Here he writes about how Gr8r approaches hiring, product design and AI engineering. More on the About page.
For a filled in report, read our UX audit of Cendara, a claims product we built. It ranks twelve findings and puts the one high finding first. Built by Gr8r for its own portfolio. Not client work.
If you want help with this, book a 30 minute call.
Related reading
- Orbital, built by Gr8r for its own portfolio
- what a UX audit is
- free UX audit for the first 5 companies
- talk to us