


Pulse AI: analytics that explain what changed and what to do next.
How we designed an analytics product where AI finds the anomaly, shows its evidence and suggests the next step, so a team can act without digging through dashboards.
Built by Gr8r for its own portfolio. Not client work.
- Client
- Pulse AI
- Project
- AI analytics web app
- Platforms
- Web app, desktop-first
- Deliverable
- 52 screens + design system in Figma
The problem
Dashboards show numbers, not reasons.
A growth or analytics team watches revenue, users, churn and traffic across tools like Stripe, Mixpanel and Salesforce. When a number moves, someone has to notice it, find the cause and decide what to do, usually by hand and usually late. We designed Pulse AI around three questions: what changed, why did it change, and what should we do about it?
- 1
Changes are noticed late
A revenue drop at 2 AM or a churn spike in one region sits inside a chart until someone happens to look. By then the damage is done.
“Did anything important change today?”
- 2
The cause takes digging
Explaining a change means cross-checking payments, deployments, campaigns and traffic in separate tools, and the answer arrives as an opinion, not evidence.
“Why did this number move?”
- 3
Insight doesn't lead to action
Even a good finding stops at a chart. The logs to check, the campaign to send or the team to contact are somewhere else.
“What should we do about it?”
Information architecture
Analysis first, data and setup after.
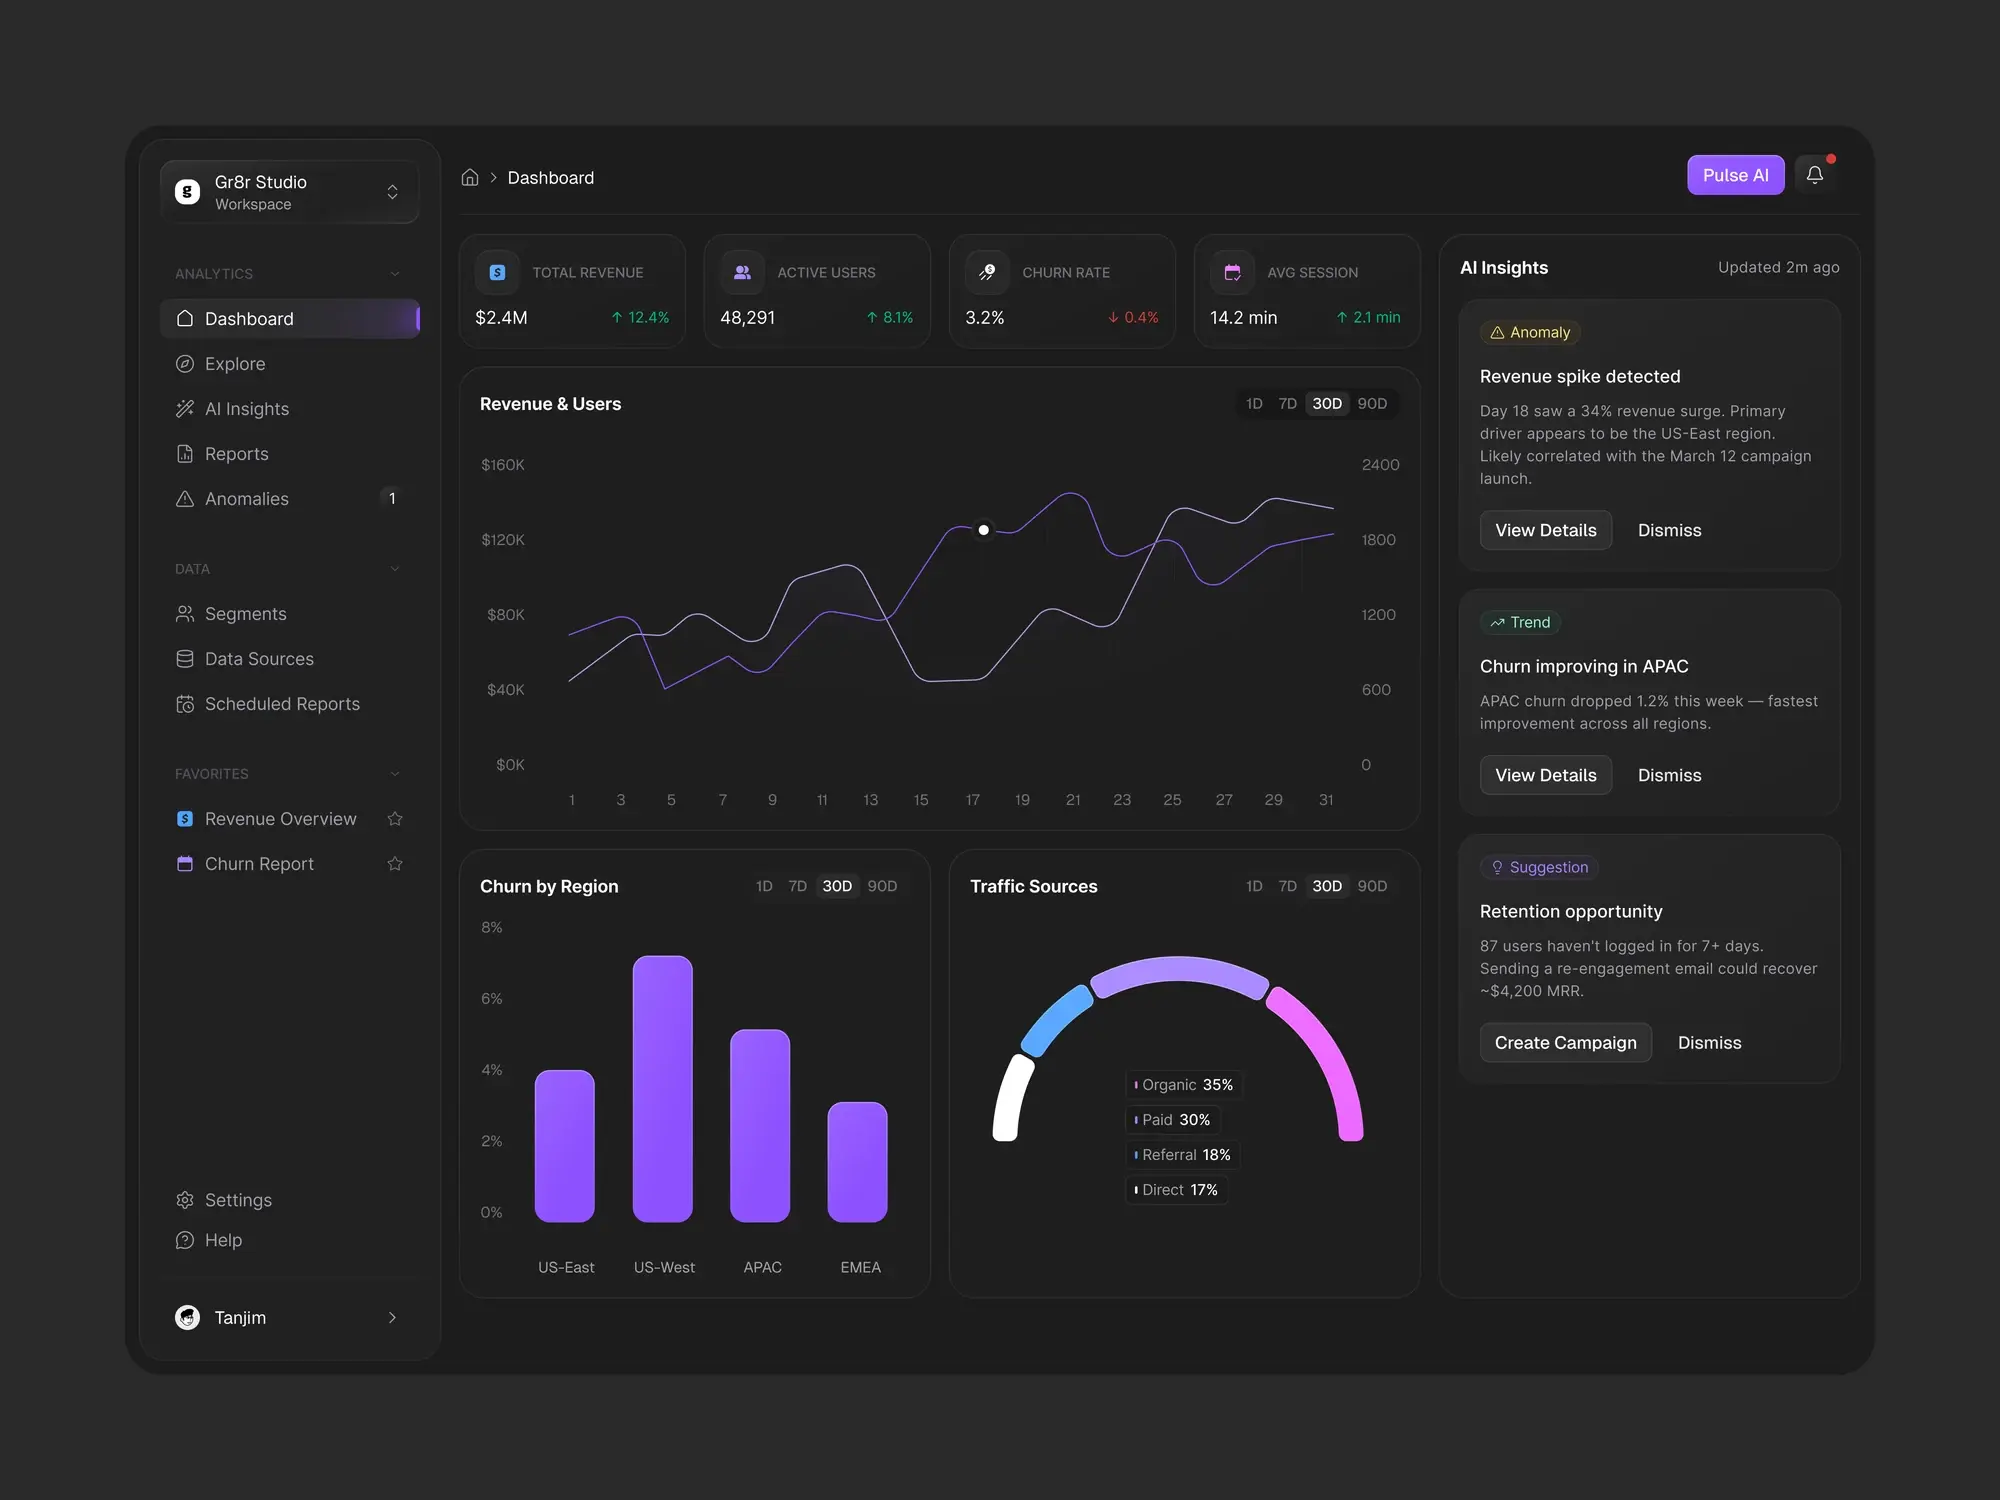
The sidebar groups the product by what the team is doing, in the same order as the app, with favourite reports pinned below.
Analytics
- Dashboard
- Explore
- AI Insights
- Reports
- Anomalies
Data
- Segments
- Data Sources
- Scheduled Reports
Settings
- Profile
- Workspace
- AI Preferences
- Notifications
- Team Members
- Integrations
- Billing & Subscription
- Security
The workflow
From a changed number to the next step.
- 1
Detect
Pulse AI watches every metric and flags anomalies, trends and opportunities.
- 2
Explain
Each insight carries a confidence score and the likely causes behind it.
- 3
Investigate
Logs, charts and queries open from the insight itself.
- 4
Act
Run a campaign, share a report or schedule it for the team.
The product
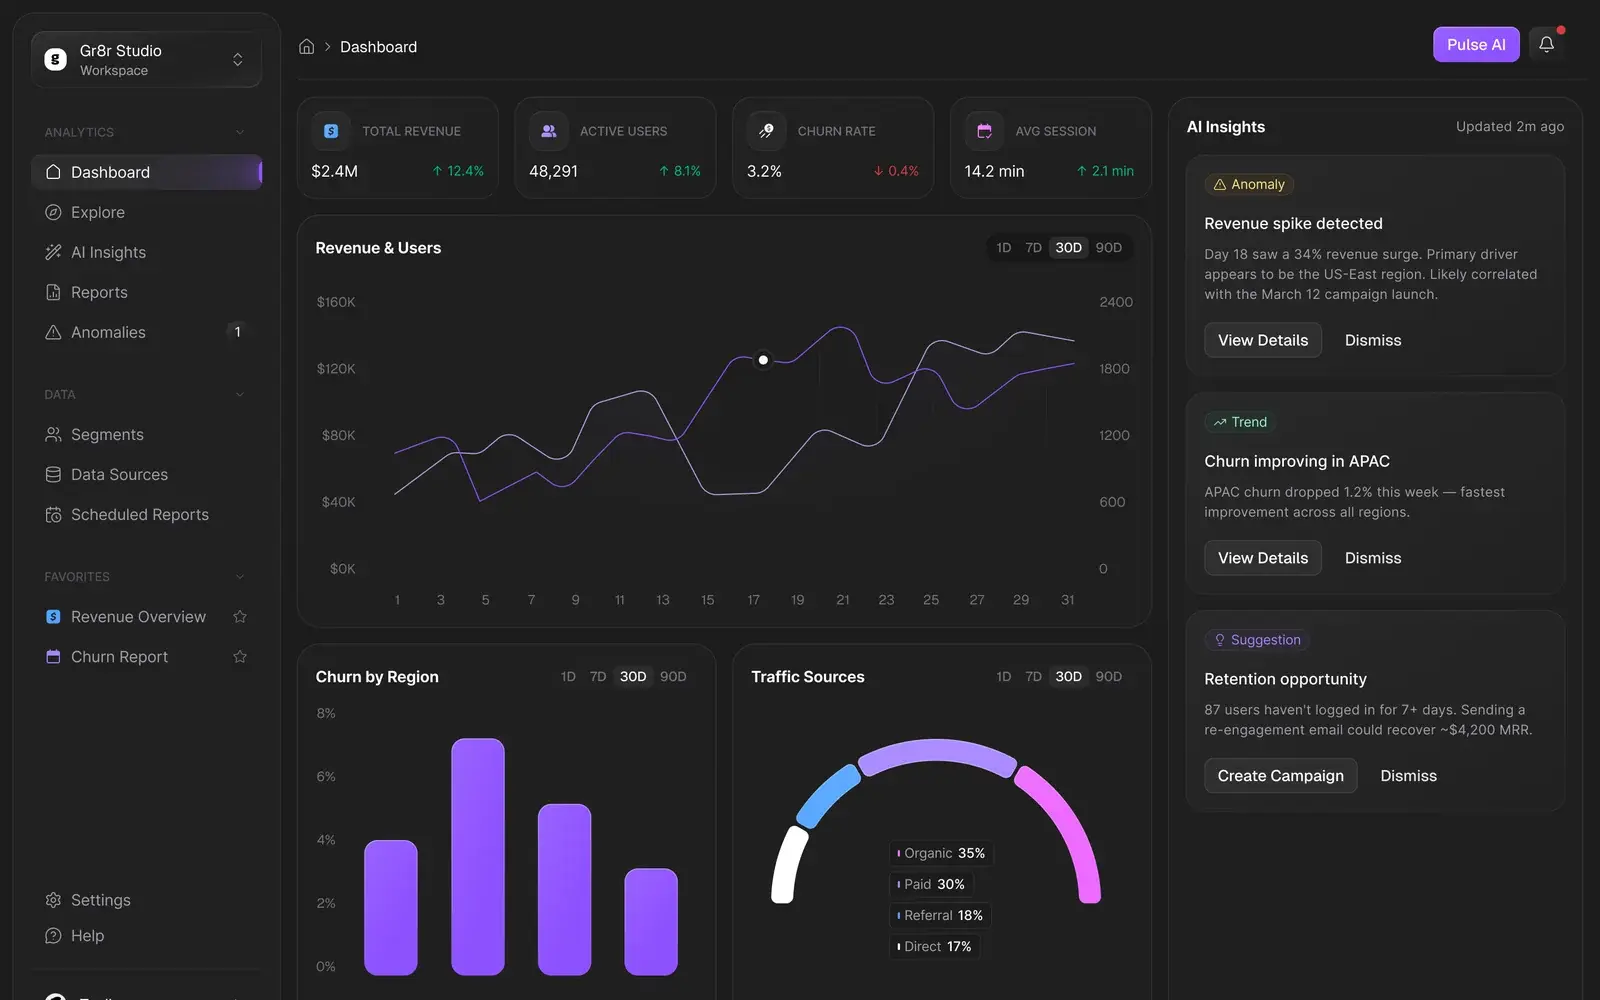
AI that shows its working.
Six close-ups that show how the interface turns raw metrics into explained insights and clear next steps.
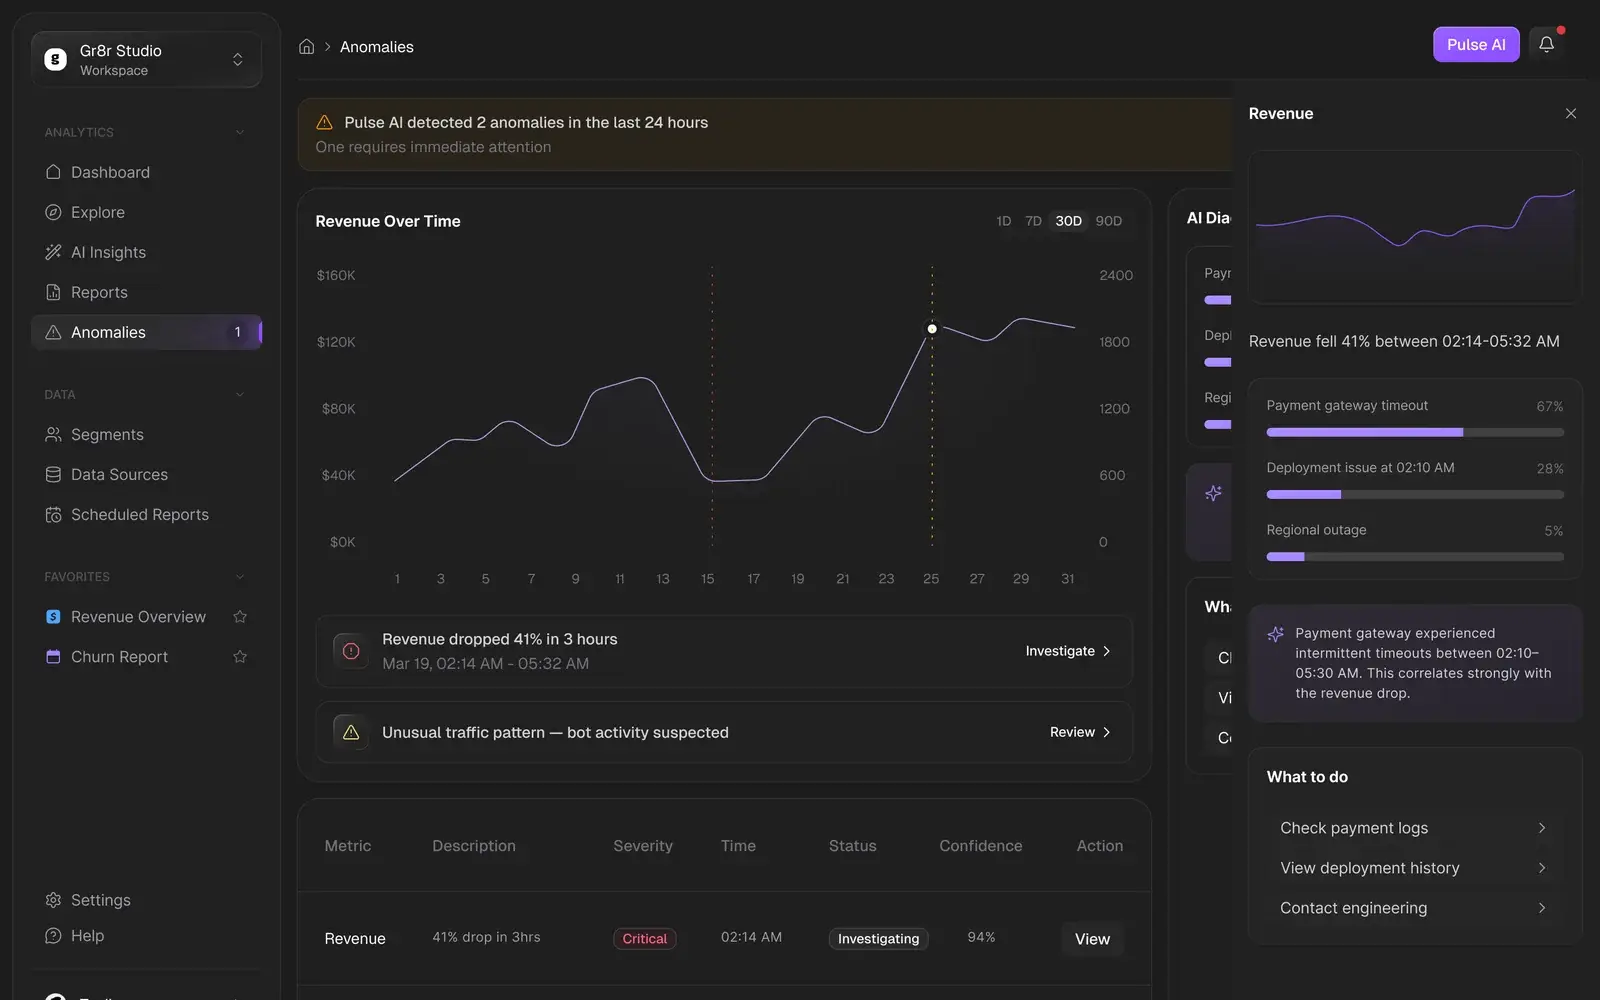
- Anomalies
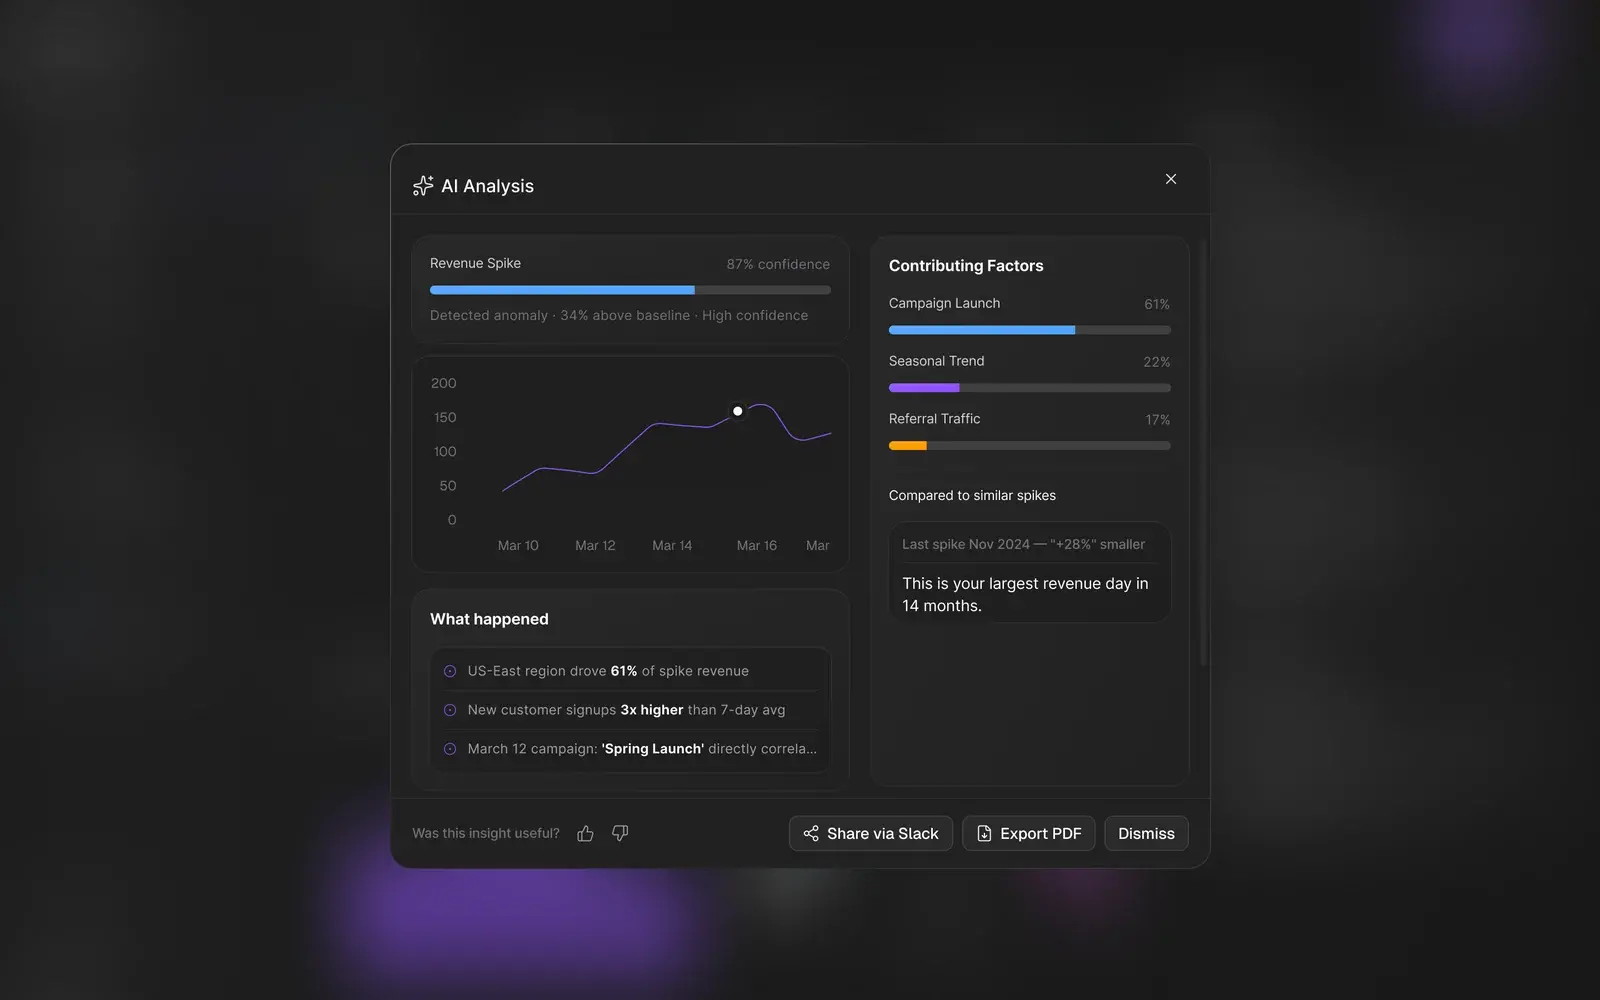
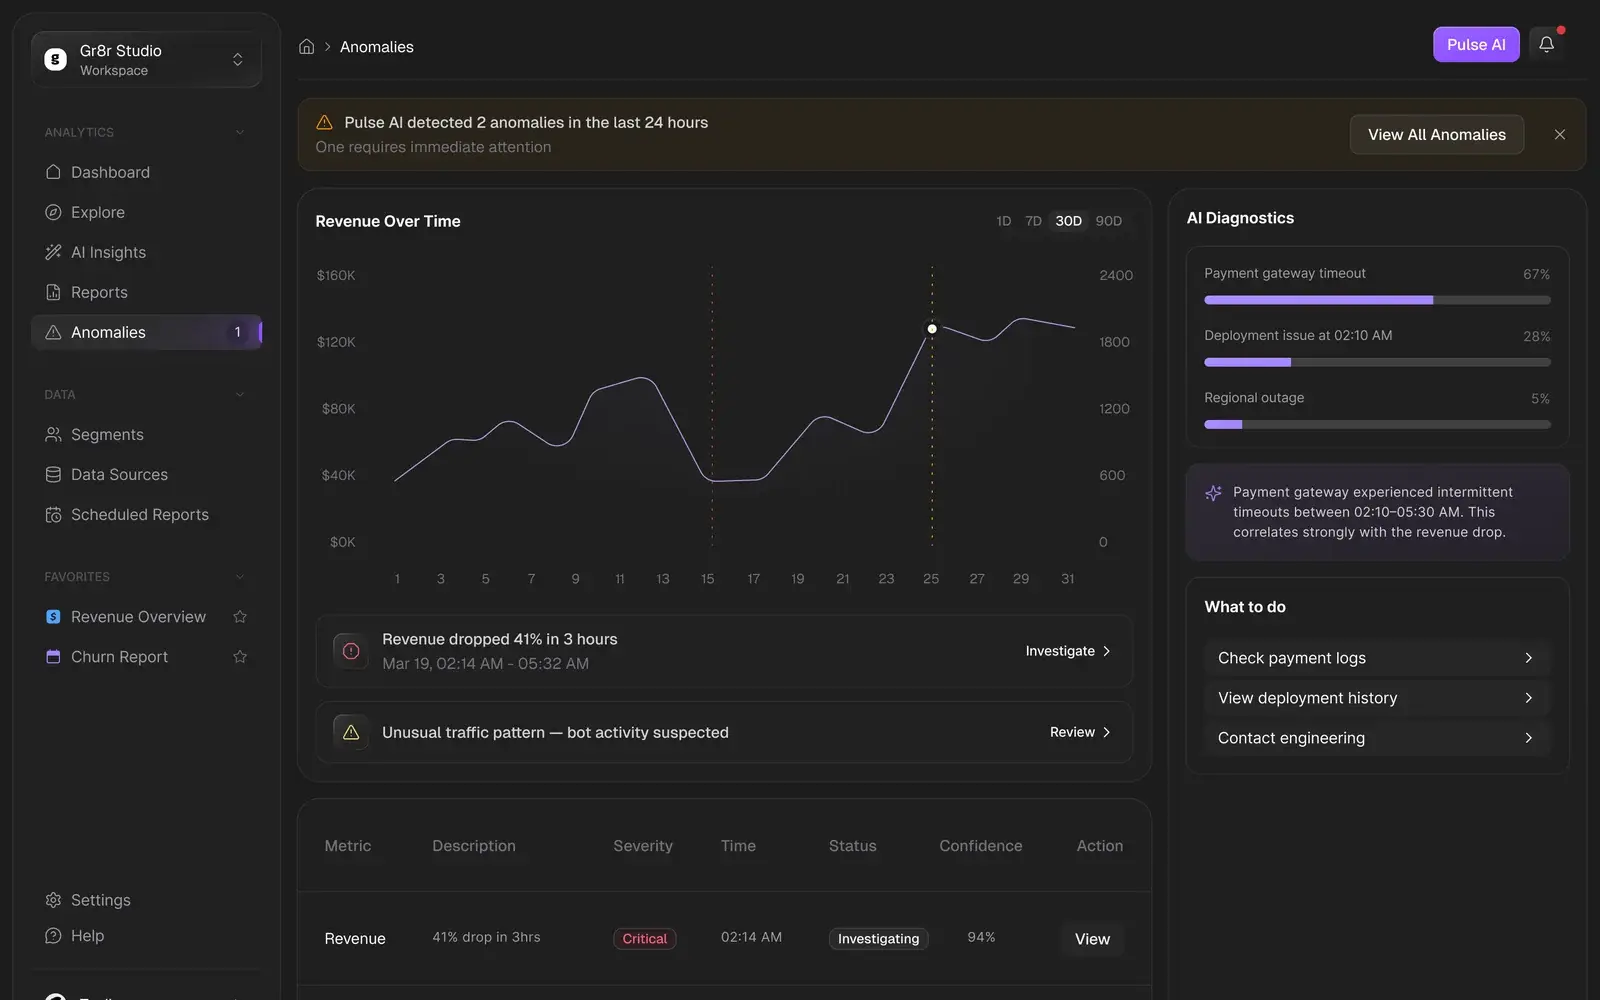
An anomaly, its cause and what to do, on one screen.
The banner says how many anomalies were found and which one is urgent. The chart marks where revenue dropped, AI diagnostics rank the likely causes, and the next steps sit beside them.
- AI Insights
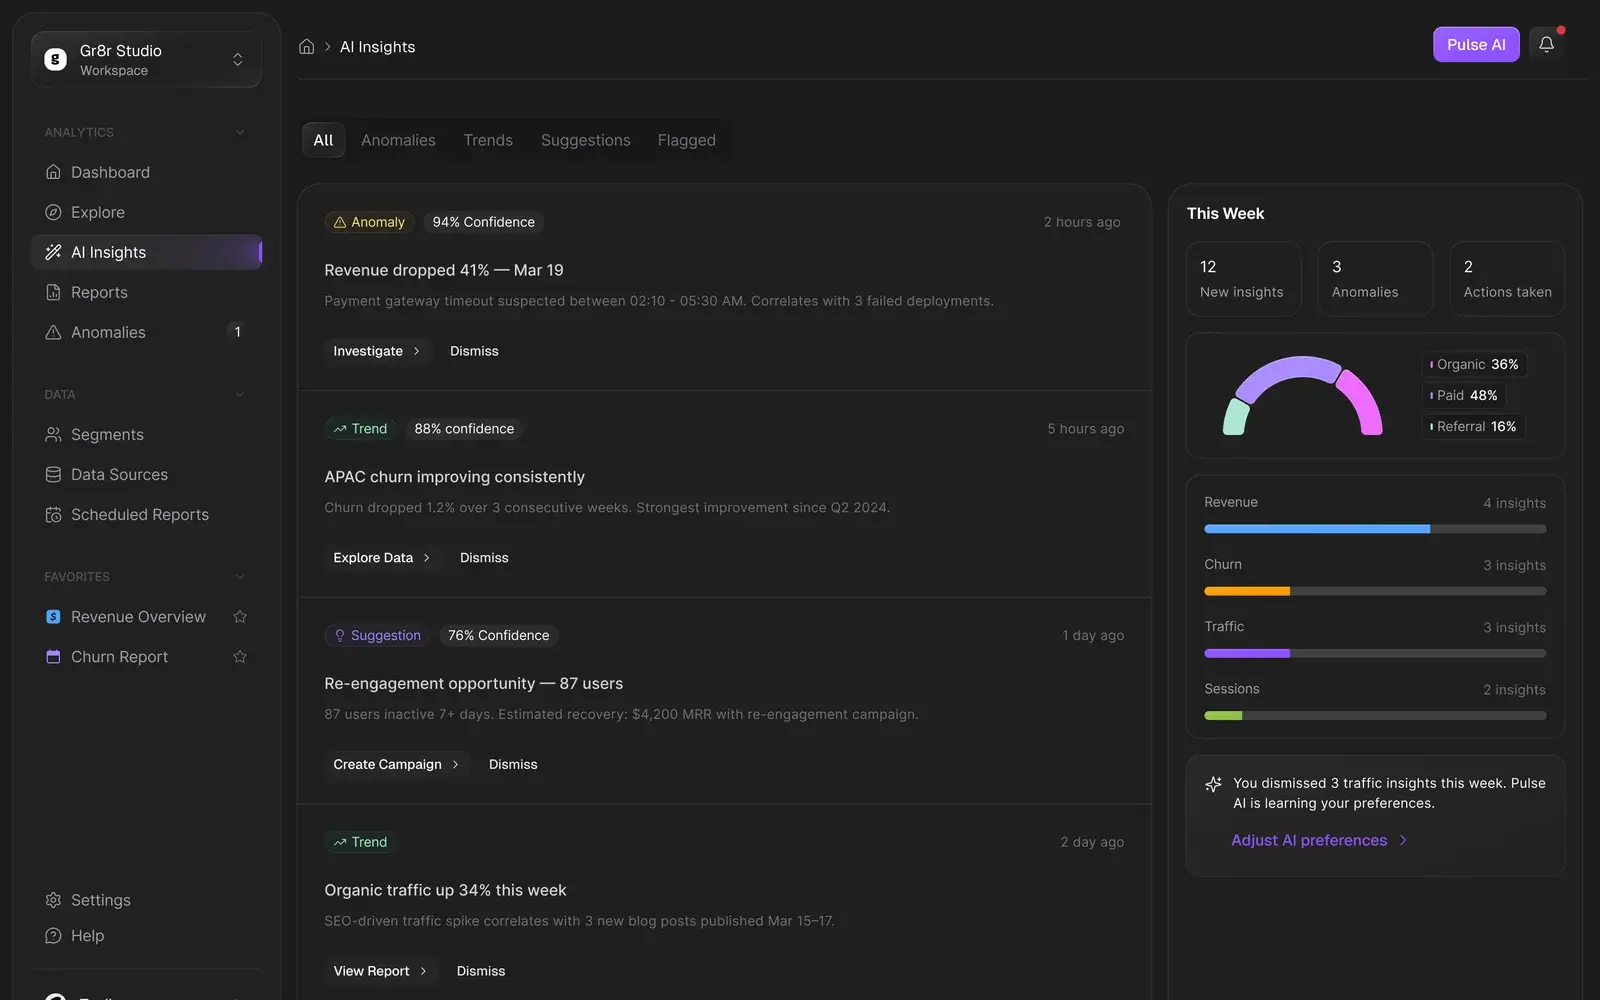
Every insight states how sure it is.
Anomalies, trends and suggestions arrive in one feed. Each card shows a confidence score, a plain explanation and the action that follows, from Investigate to Create Campaign.
- Explore
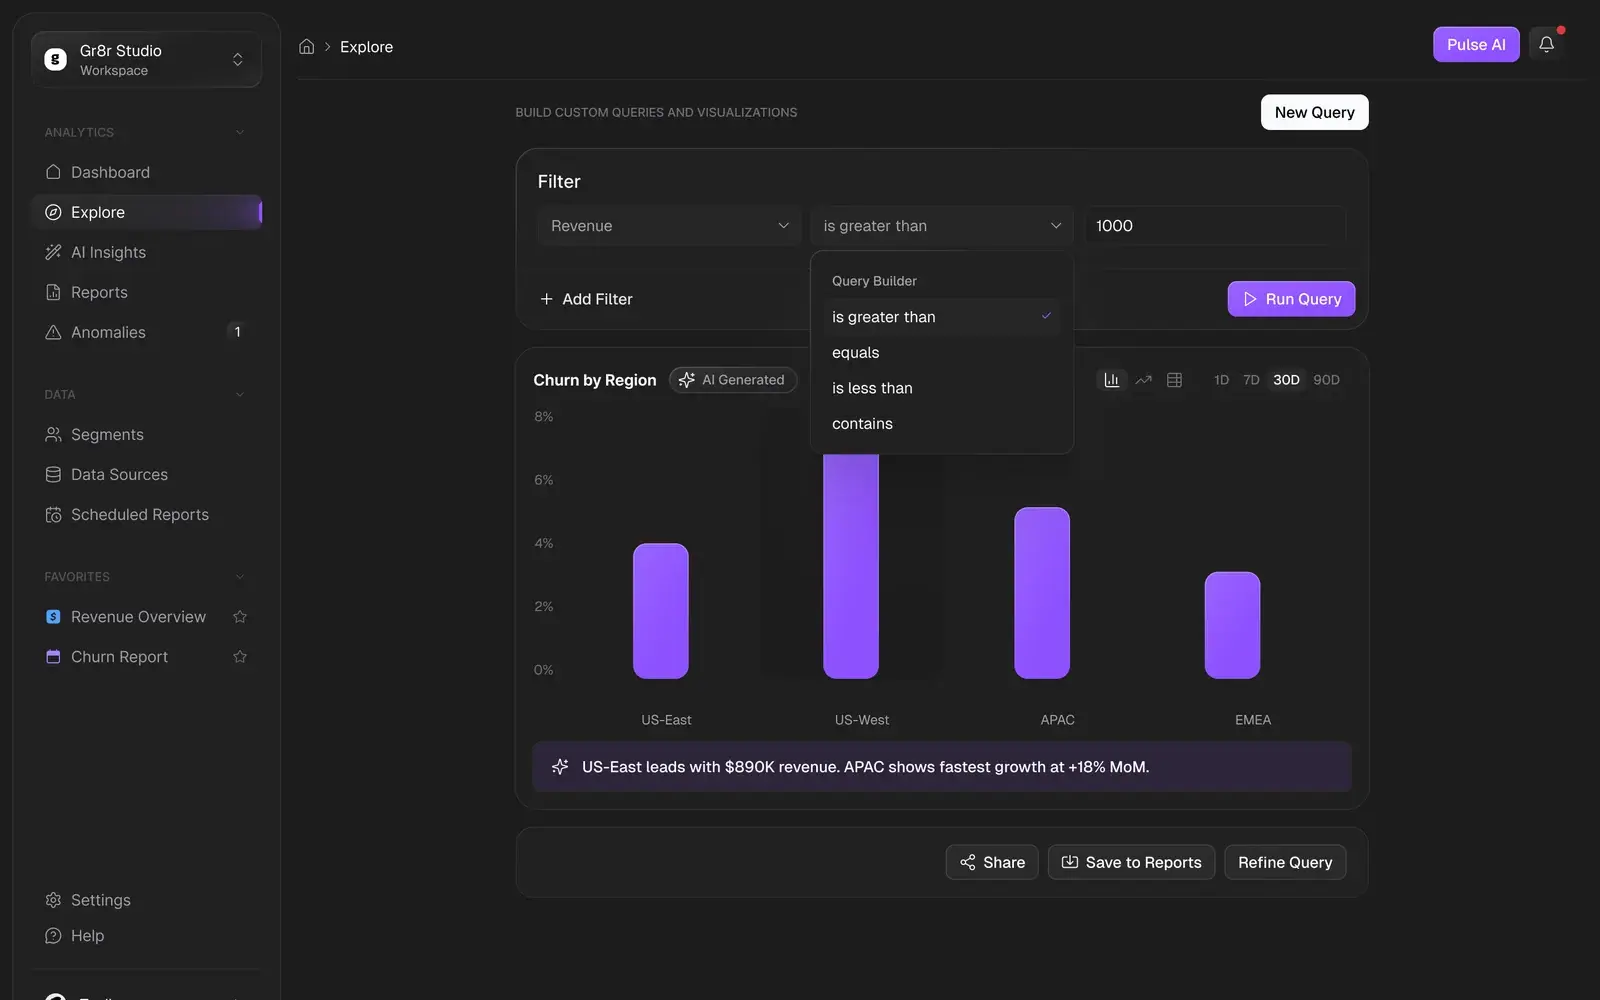
Questions without writing queries.
A query builder of plain dropdowns (metric, condition, value) produces a chart, with an AI summary of what it shows. Results can be shared, saved to reports or refined.
- Reports
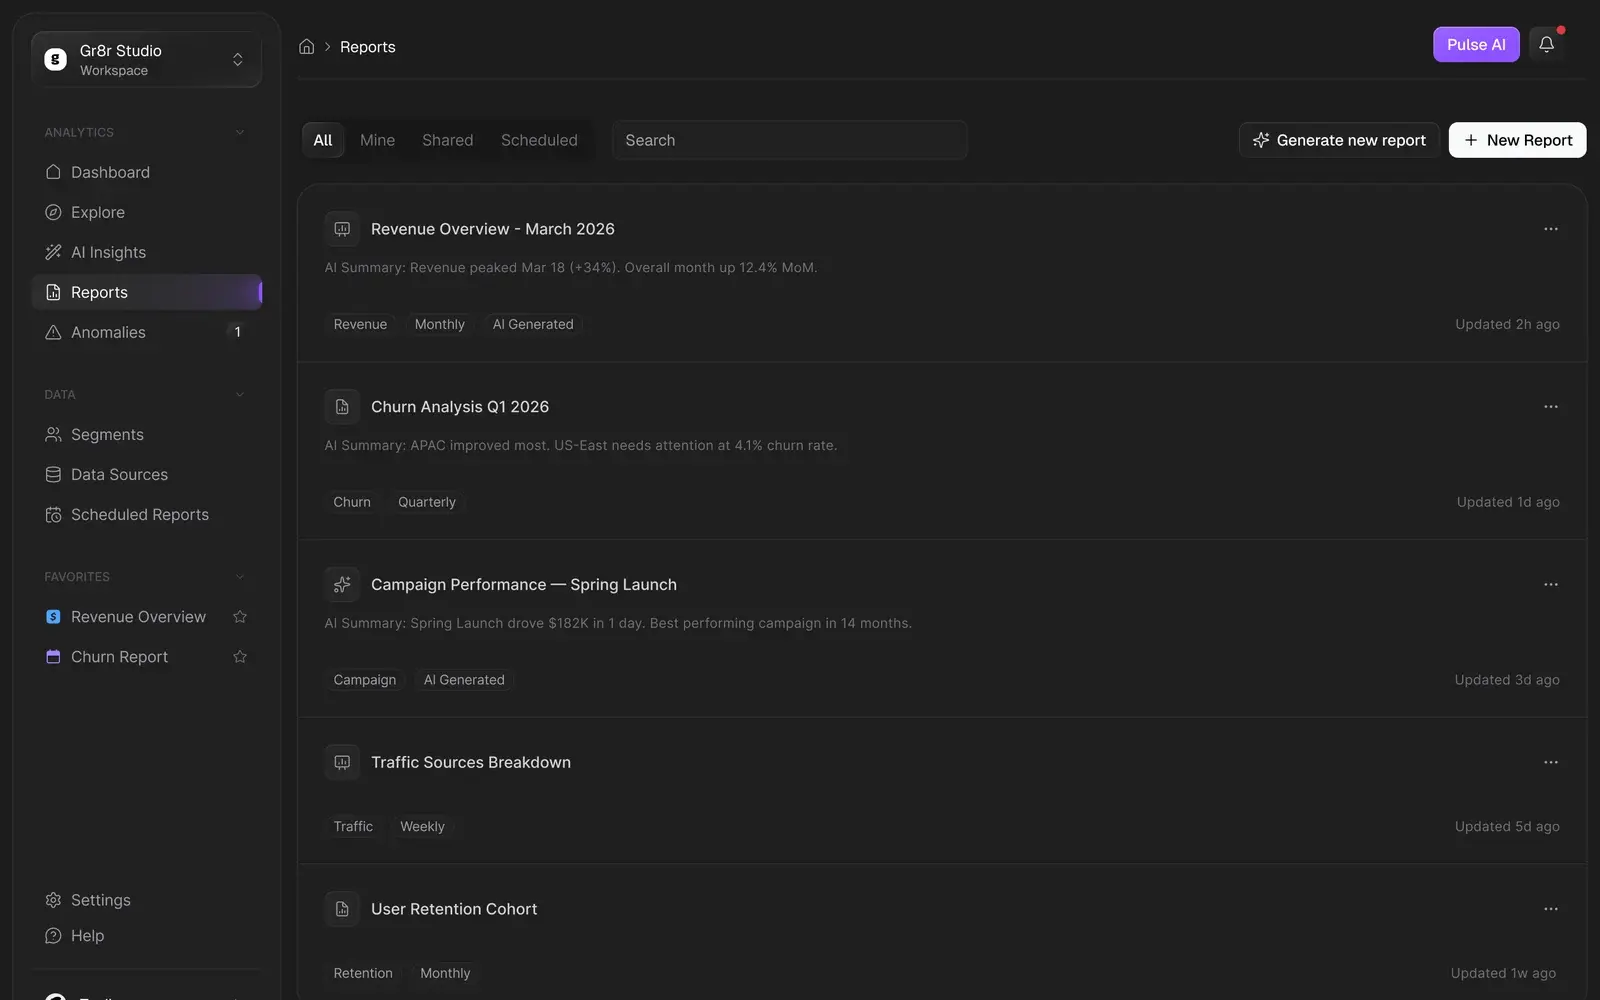
Reports that summarise themselves.
Every report opens with an AI summary line, so the list reads like a briefing. Tags show the metric, the cadence and which reports AI generated.
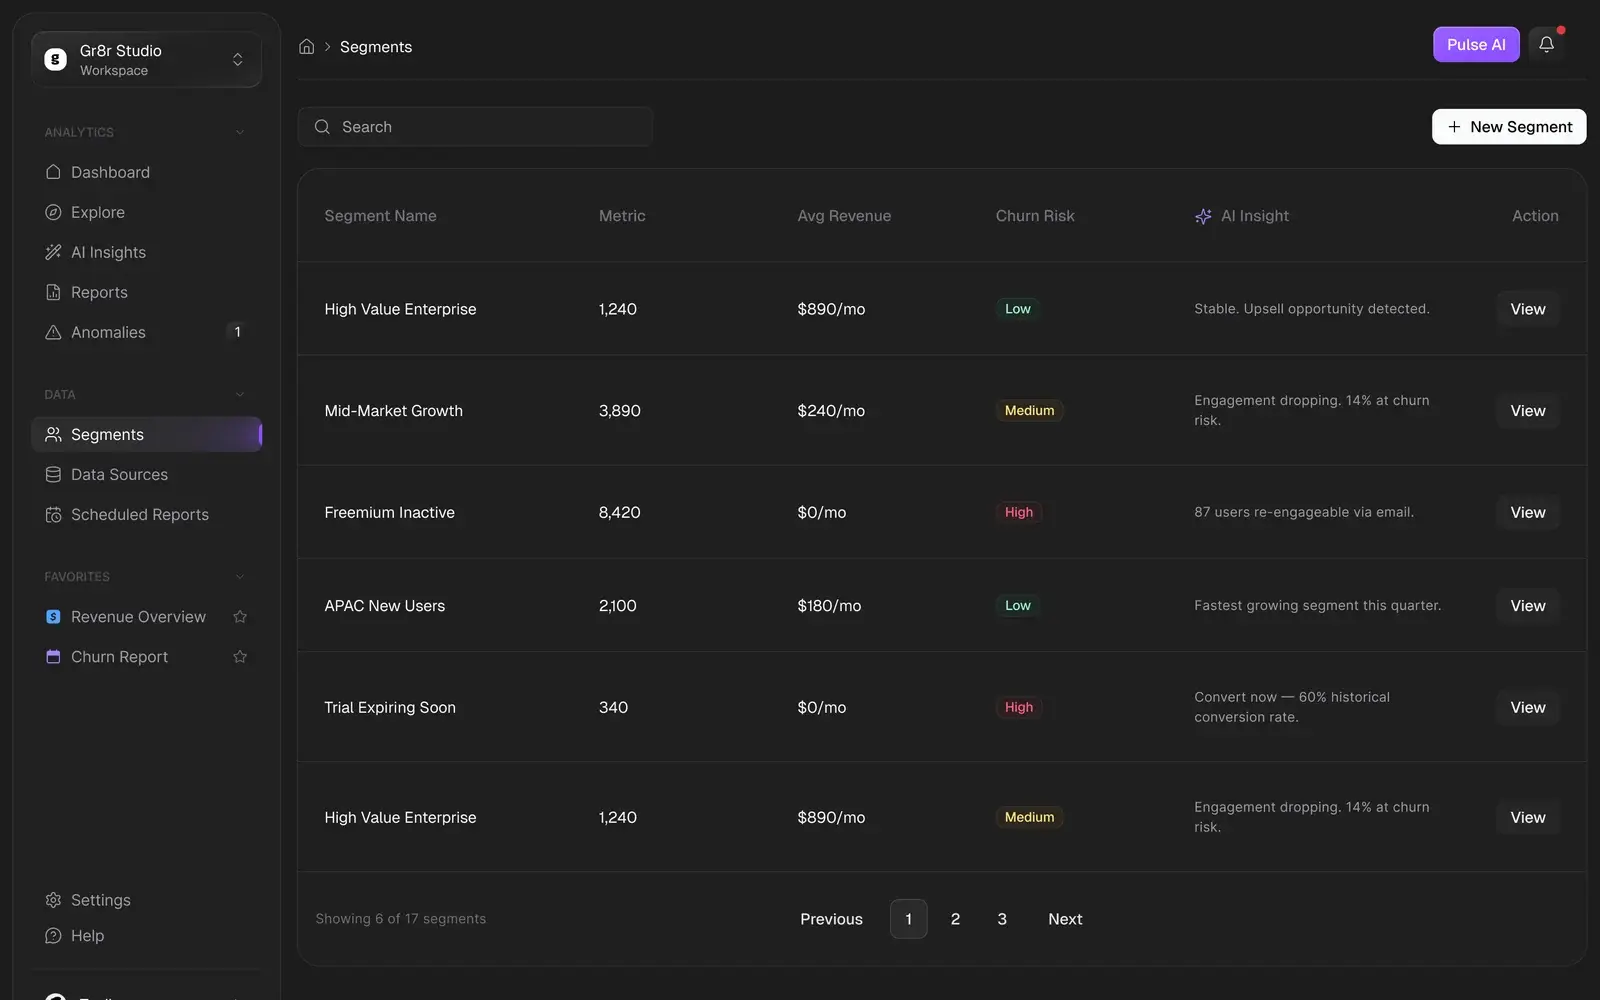
- Segments
Segments with a reason attached.
Each customer segment shows its size, average revenue and churn risk, plus an AI note on what to do with it, from an upsell to a re-engagement email.
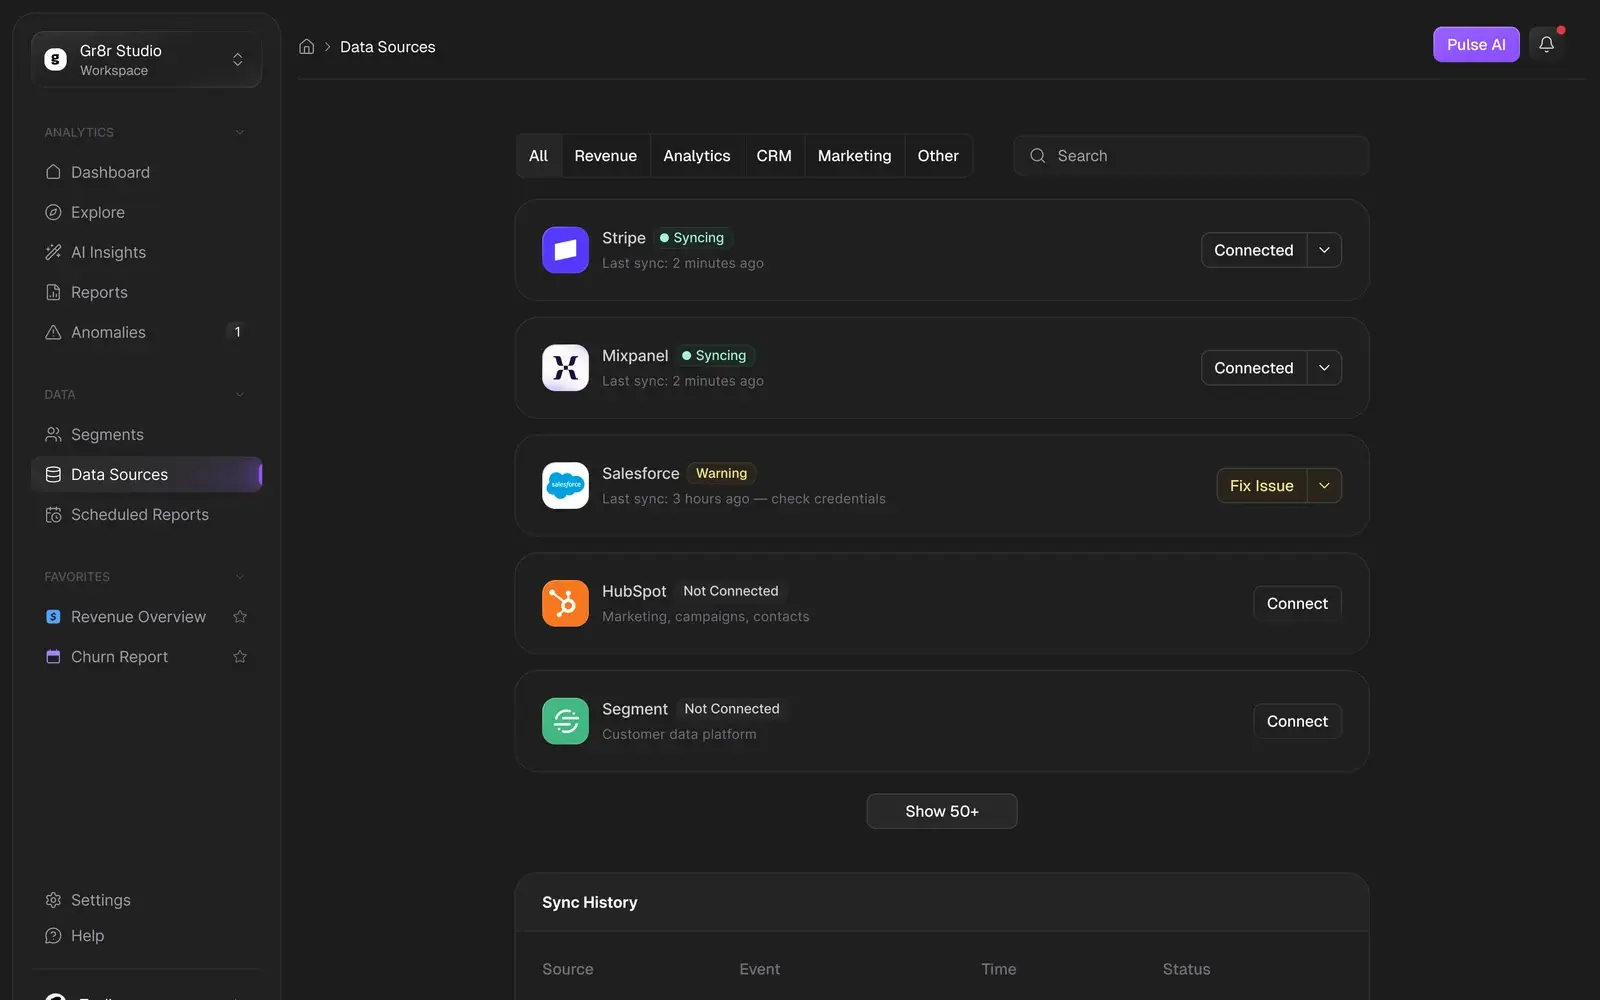
- Data Sources
Connections you can trust.
Every source shows whether it is syncing, when it last synced and what needs fixing. A Salesforce warning comes with a Fix Issue button, not a silent failure.
Interaction
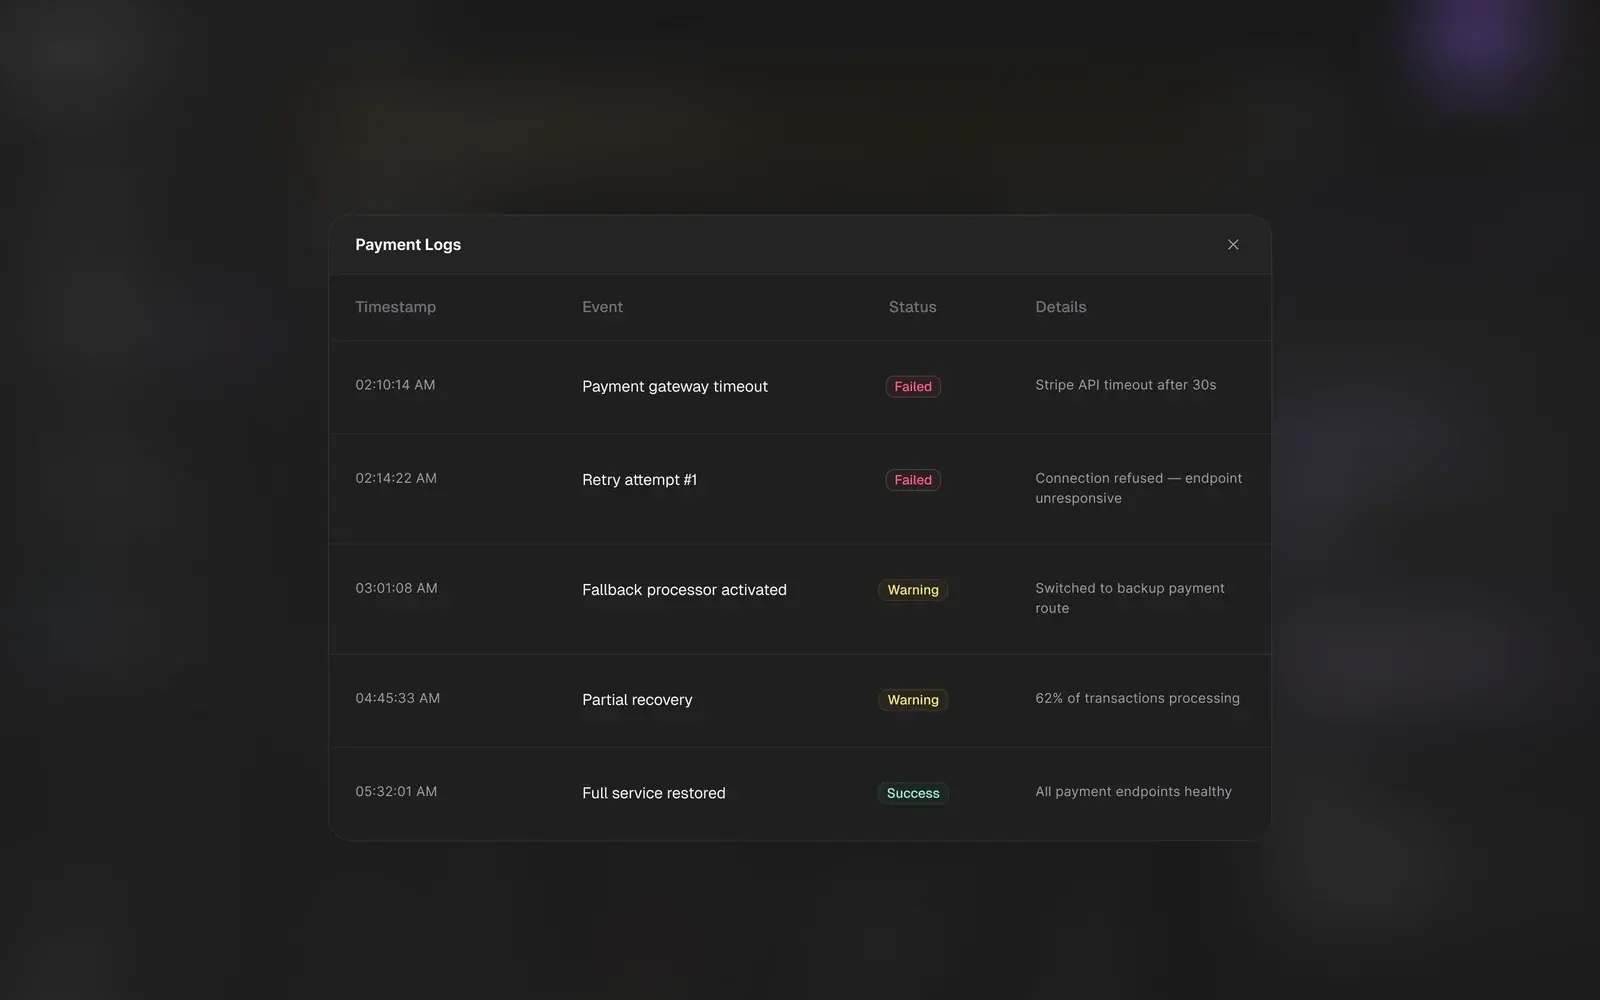
Alert, diagnosis, evidence.
One anomaly, from the alert to the logs that explain it.
Style guide
Typography & colours.
A layered dark base for long sessions, one violet for the brand and AI, and status colours that only appear when something needs attention.
Base
HEX #1C1C1C
Gray dark/200
Rose
HEX #FF2056
Violet
HEX #8E51FF
Brand/500
Emerald
HEX #00BC7D
Emerald/500
Amber
HEX #FE9A00
Amber/500
Inter
- Regular
- Medium
- SemiBold
- Bold
Every screen
Every screen, straight from the file.
Final designs from the product file, with demo data: onboarding, reporting, scheduling and settings.
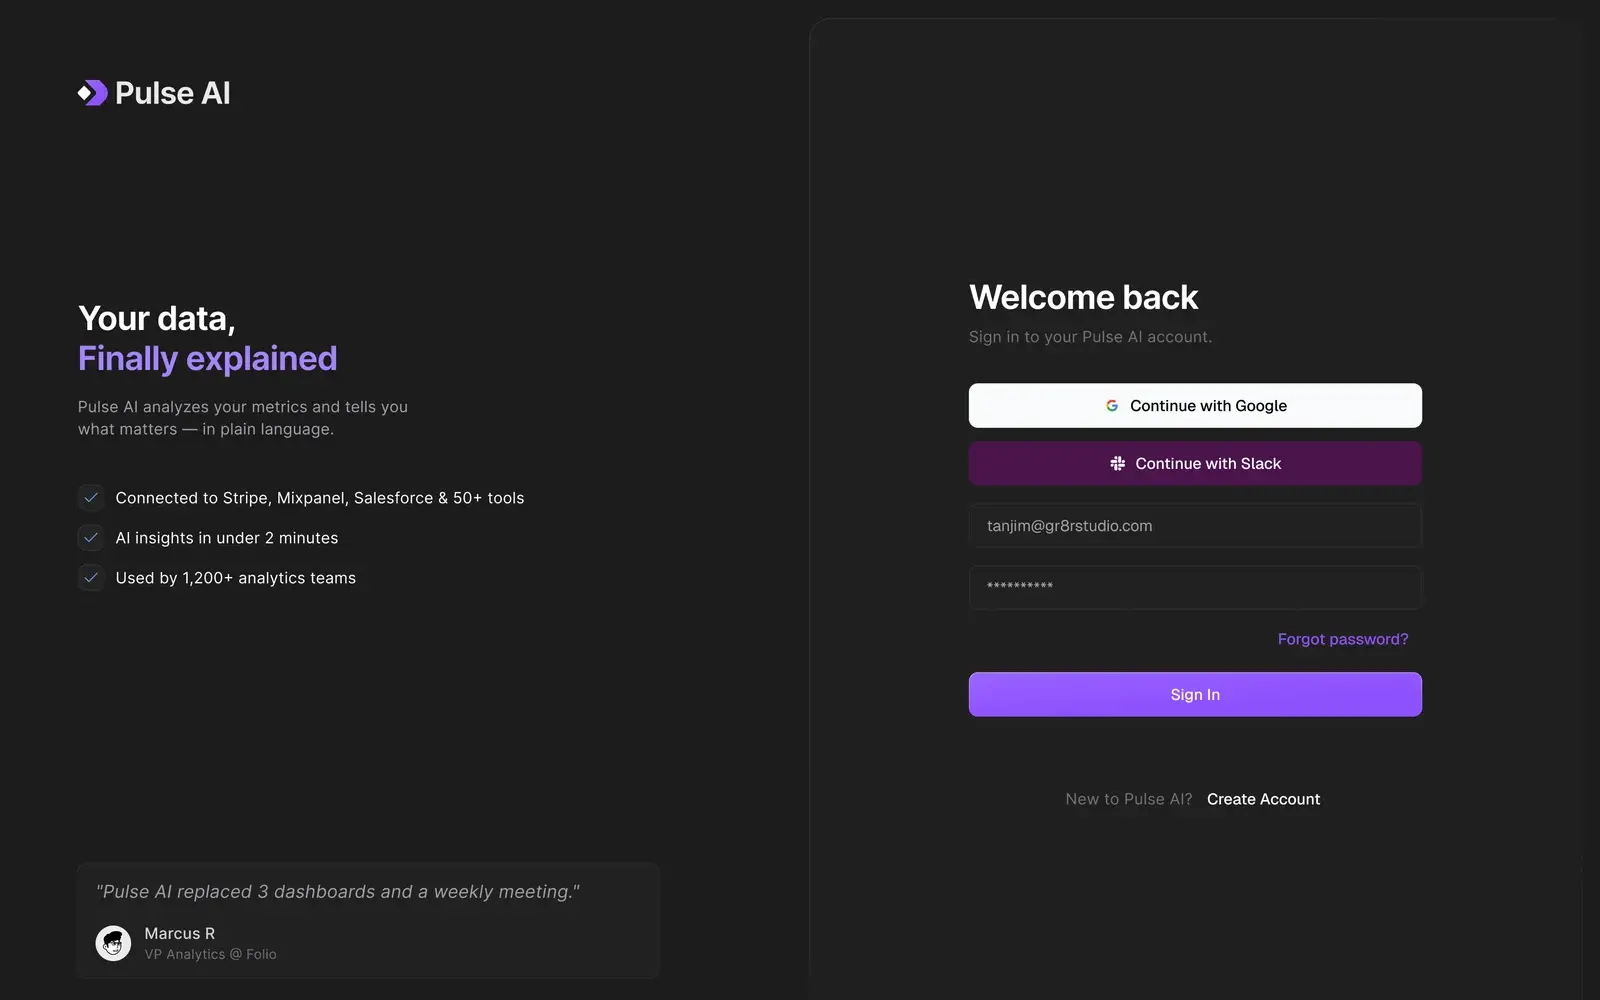
Sign in to Pulse AI 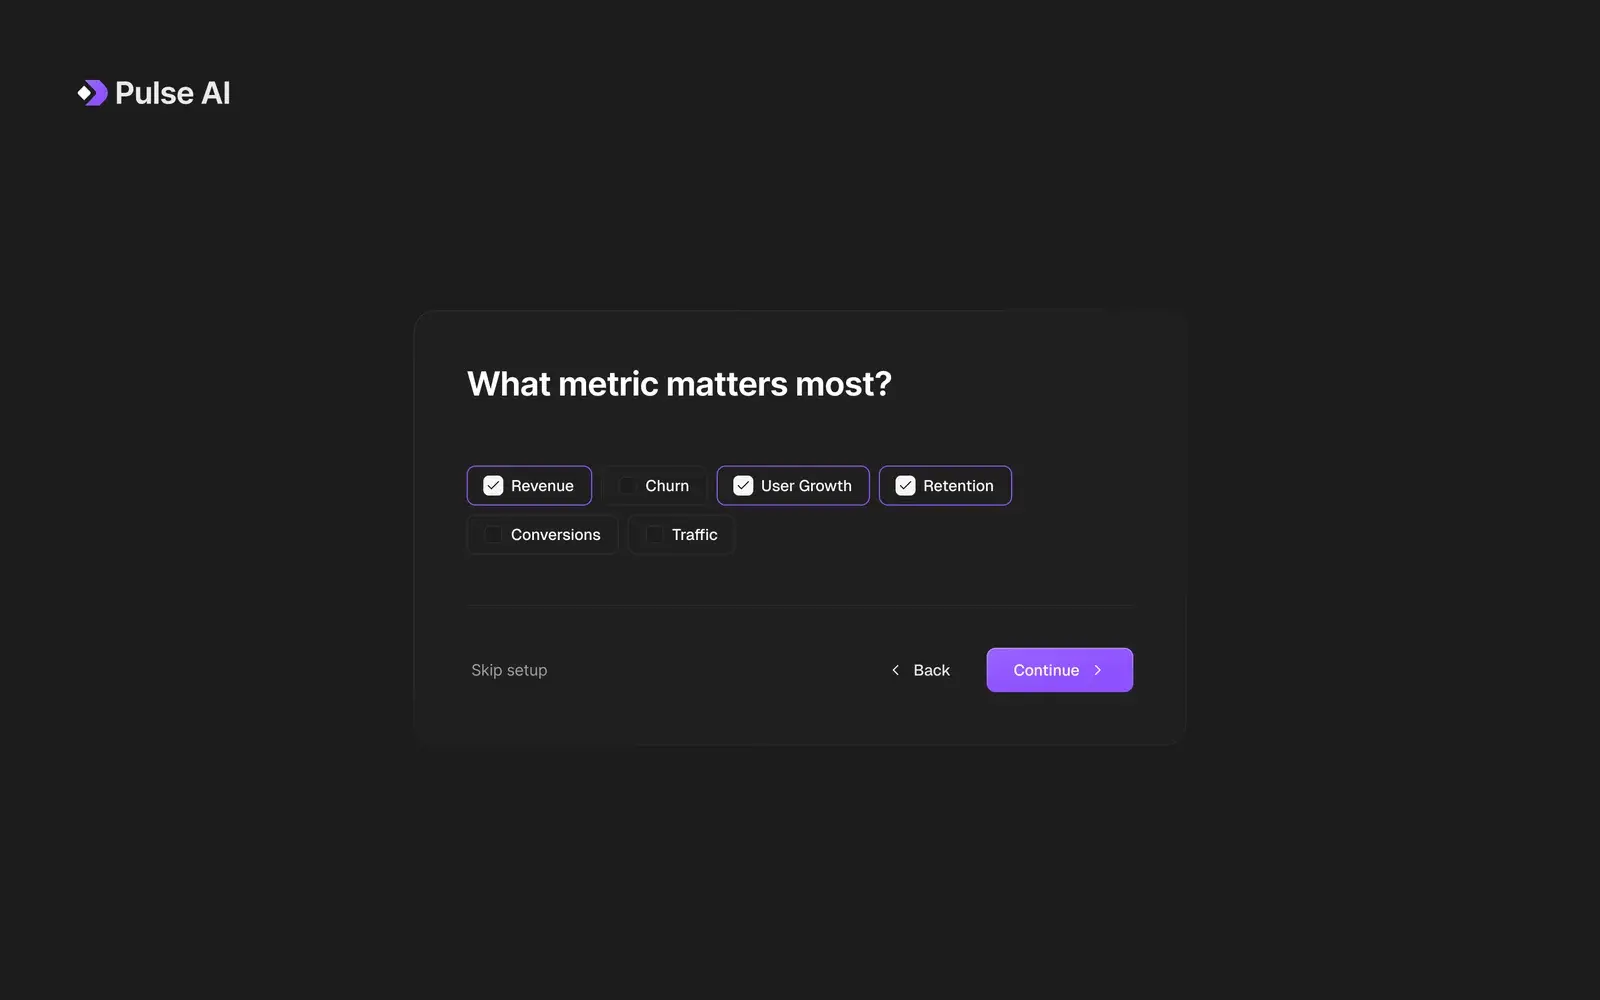
Onboarding: what metric matters most? 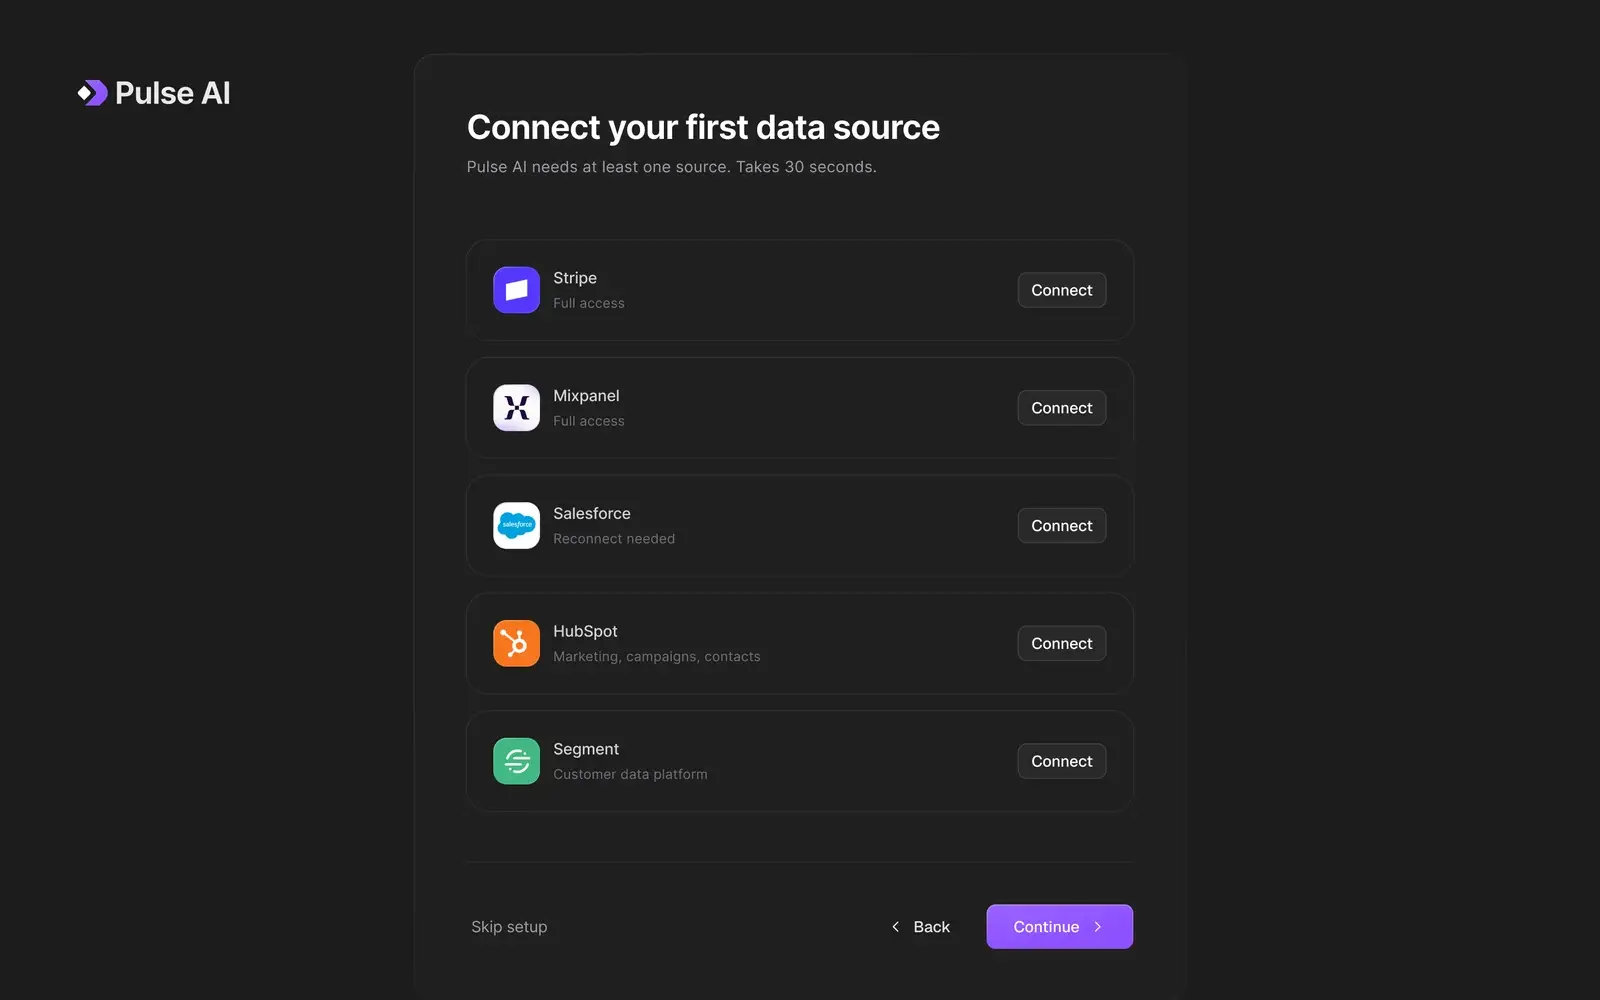
Onboarding: connect your first data source 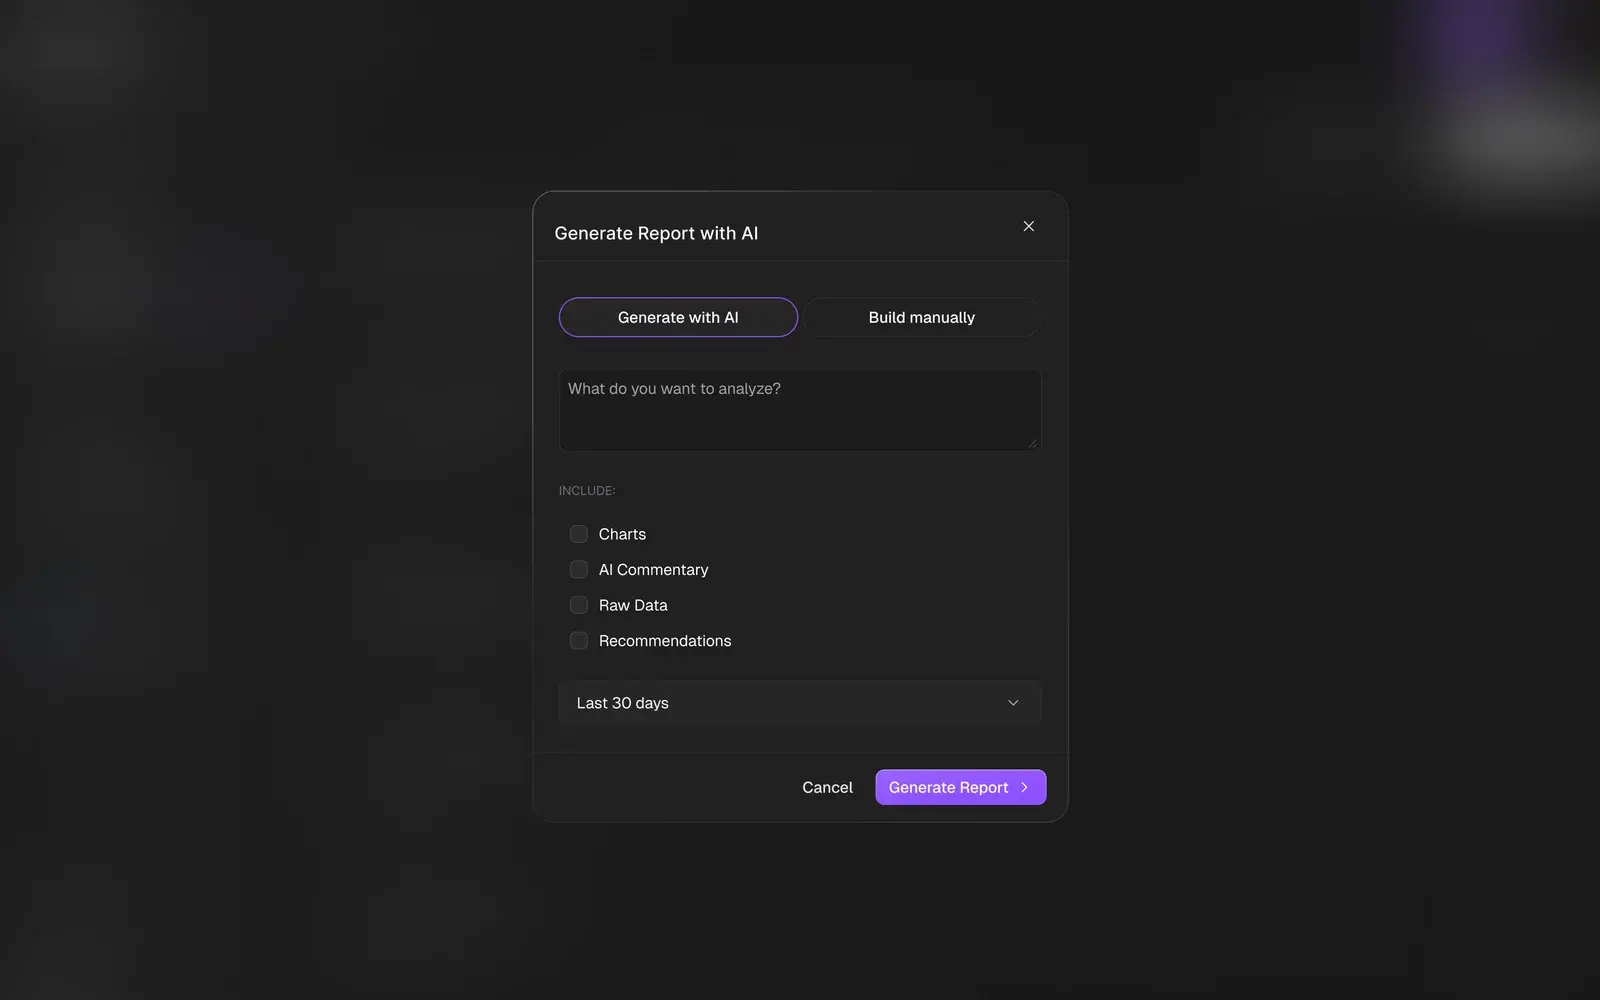
Generate a report with AI 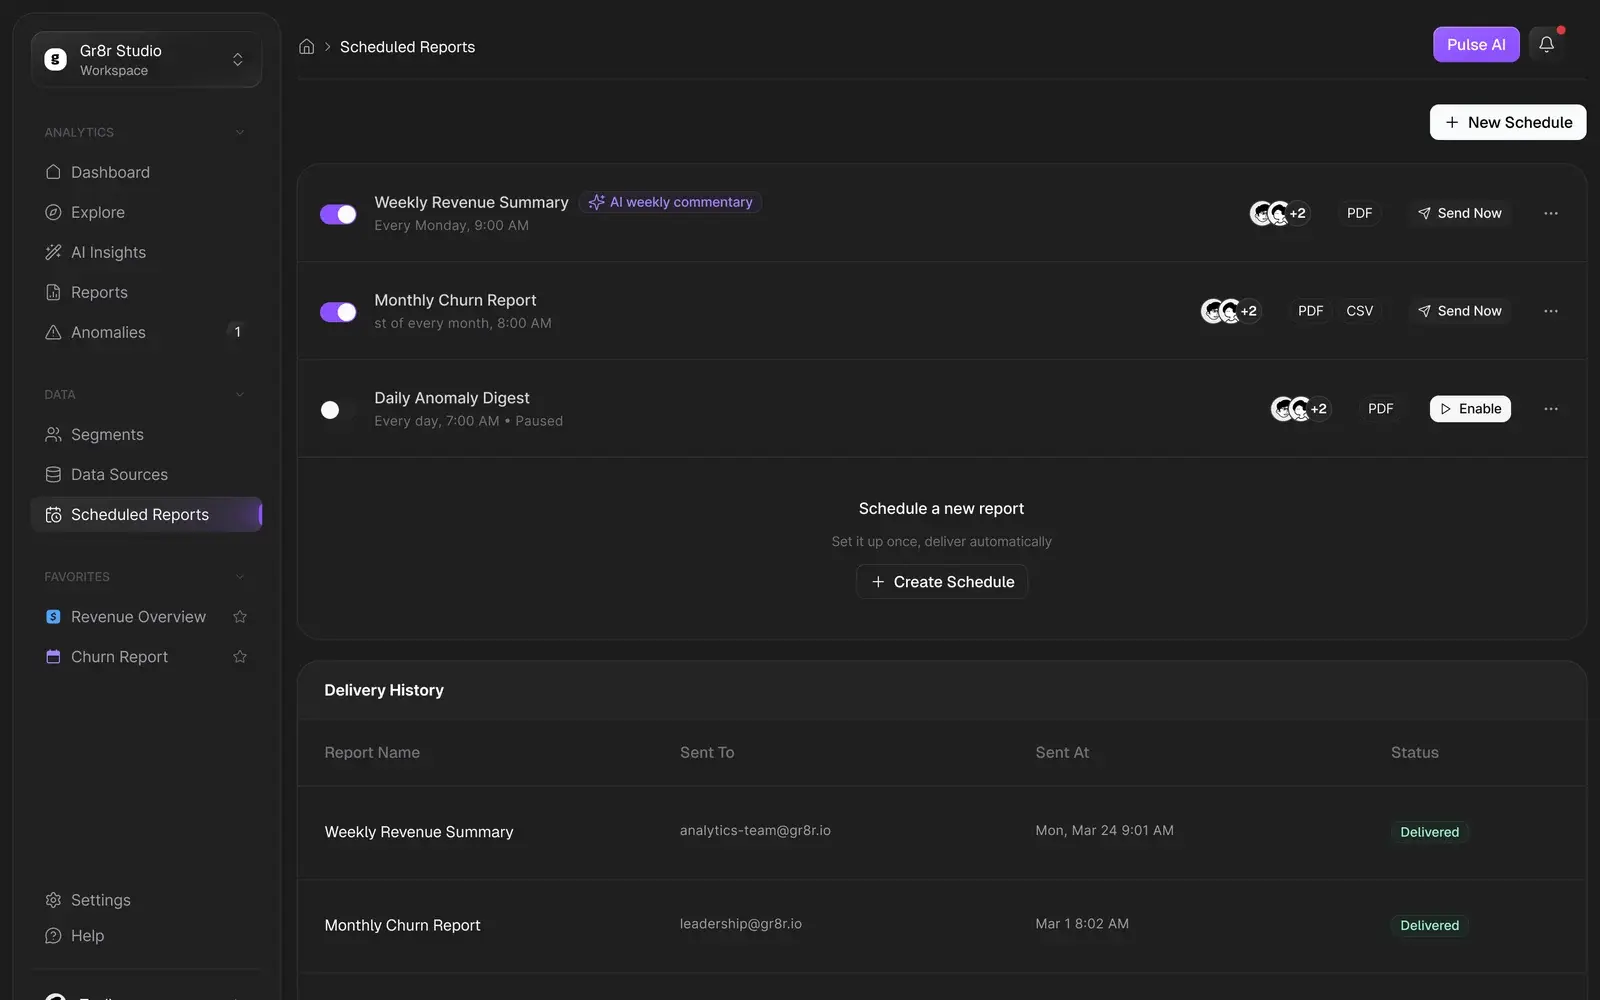
Scheduled reports and delivery history 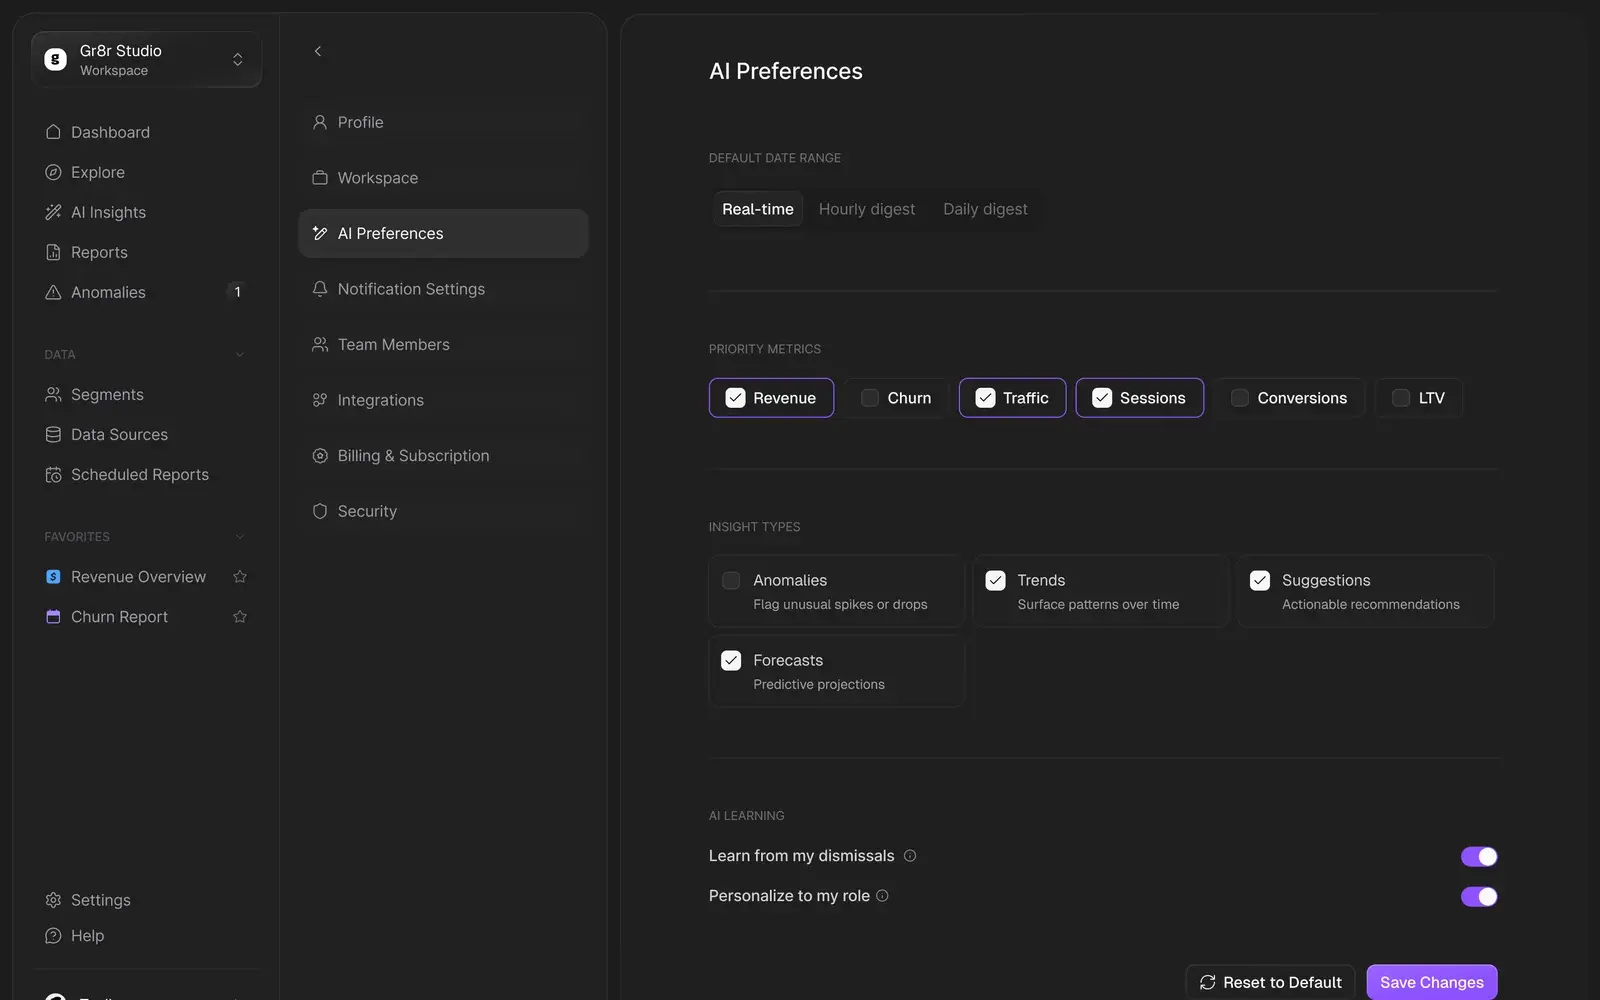
AI preferences
Design system
One system behind 52 screens.
Every screen is built from the same components and tokens: Inter type styles, a dark grey scale and status colours set up as Figma variables, so new screens and states stay consistent as the product grows.
- 52 desktop screens across 11 areas
- Inter type scale from display to label
- 508 colour variables, dark-first
- Shared components for cards, tables, modals and charts
Outcomes
A complete product, designed and ready to build.
What we delivered. Measured business results will be added only with evidence and approval.
52 screens, 11 areas
From onboarding to settings, every flow the product needs, with its states and modals.
AI with visible evidence
Confidence, causes and logs sit beside every insight, so people can check before they act.
A system in variables
Type and colour set up as Figma variables, with components the engineers build from.